

Are birds smarter than mathematicians? Pigeons (Columba livia) perform optimally on a version of the Monty Hall Dilemma
- PMID: 20175592
- PMCID: PMC3086893
- DOI: 10.1037/a0017703
Are birds smarter than mathematicians? Pigeons (Columba livia) perform optimally on a version of the Monty Hall Dilemma
Abstract
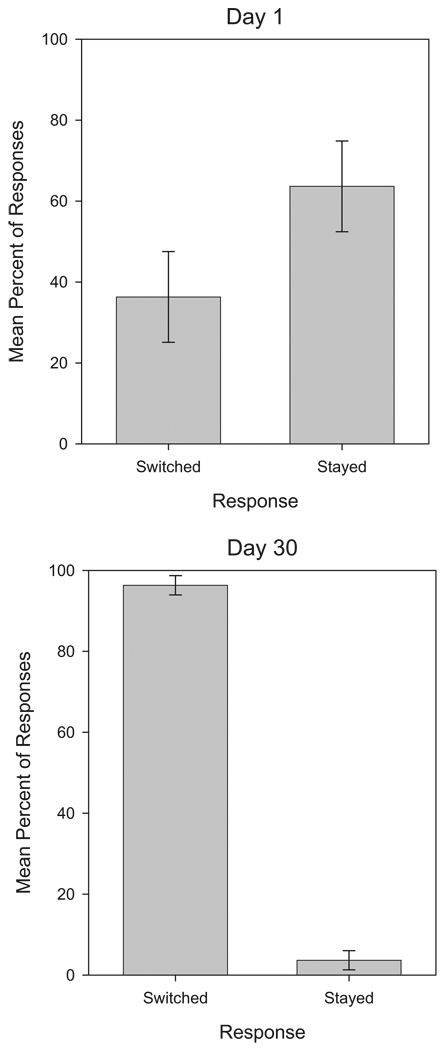
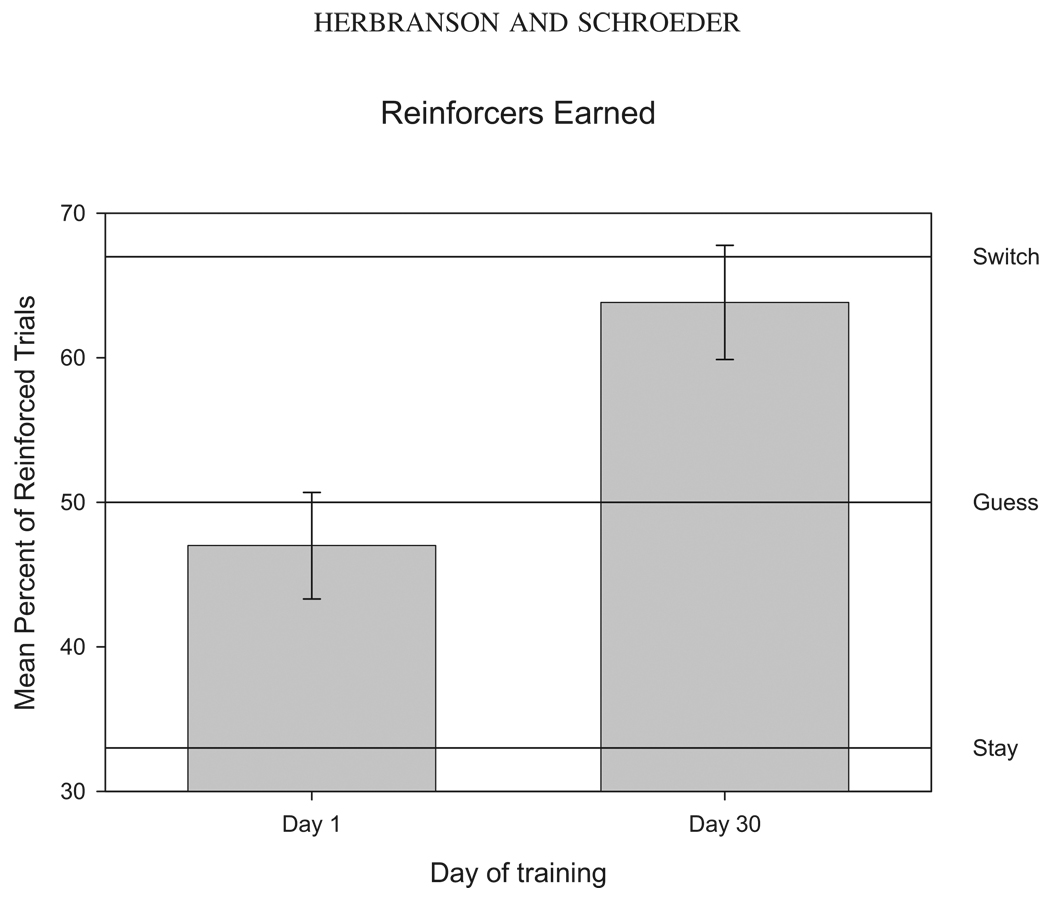
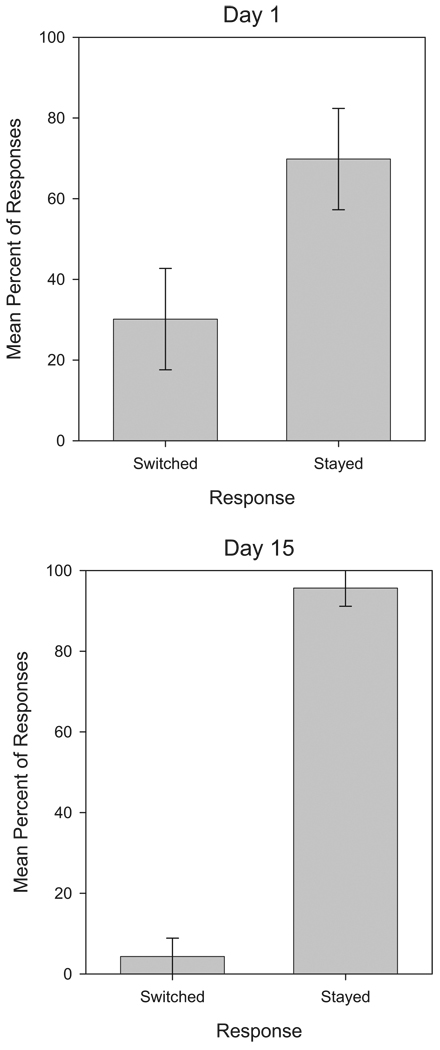
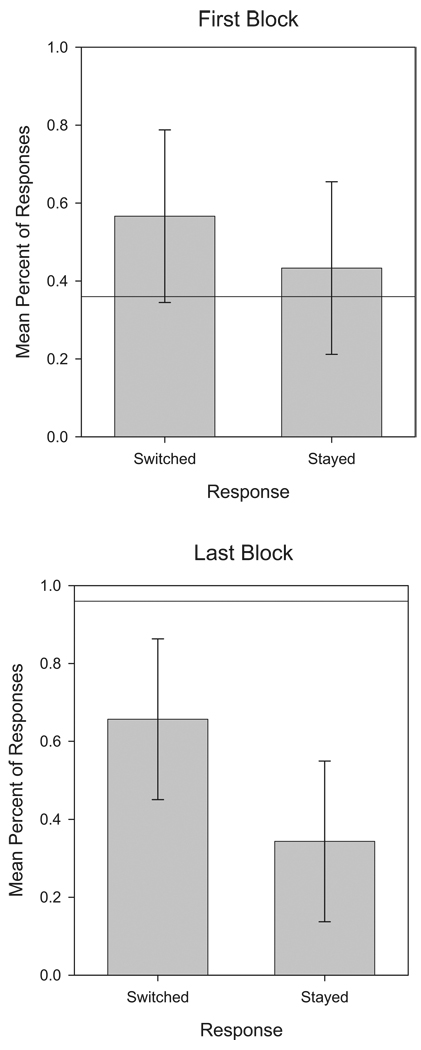
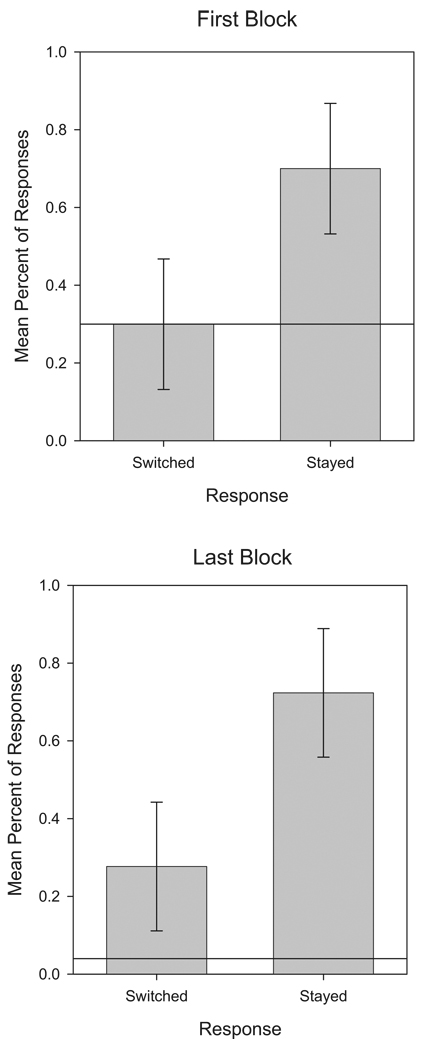
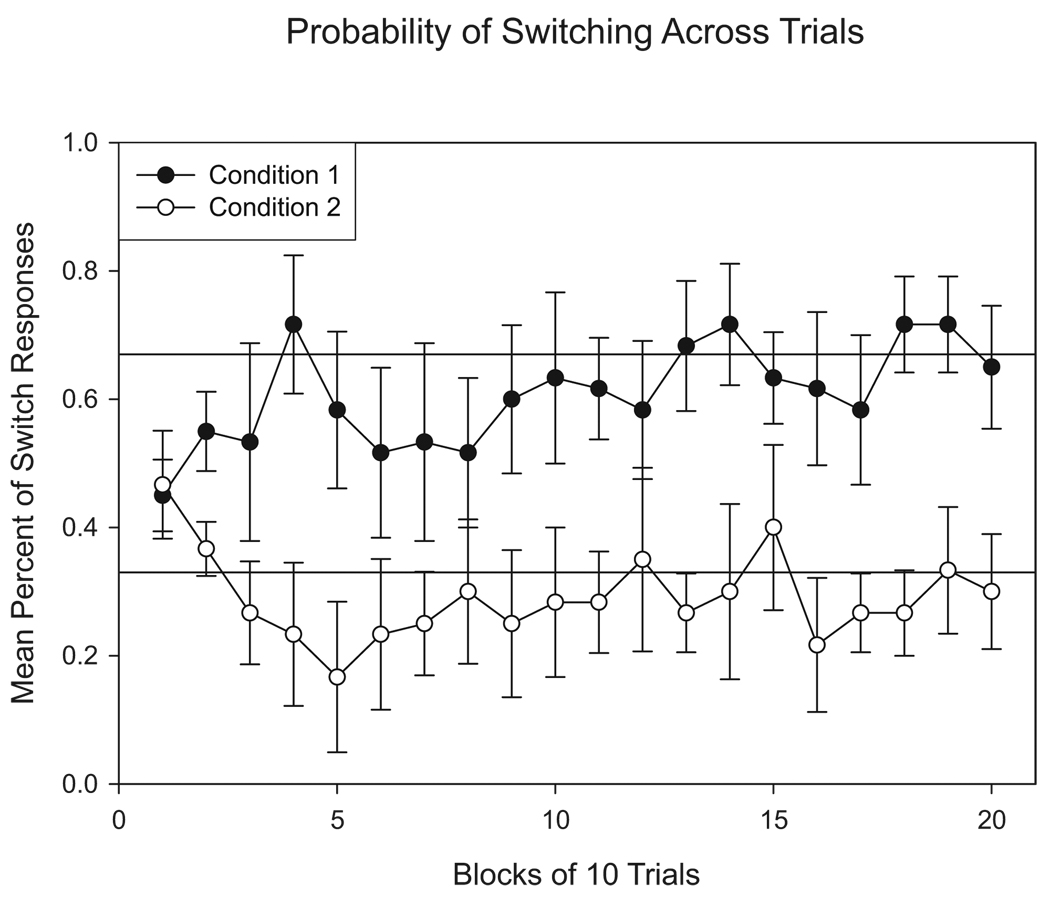
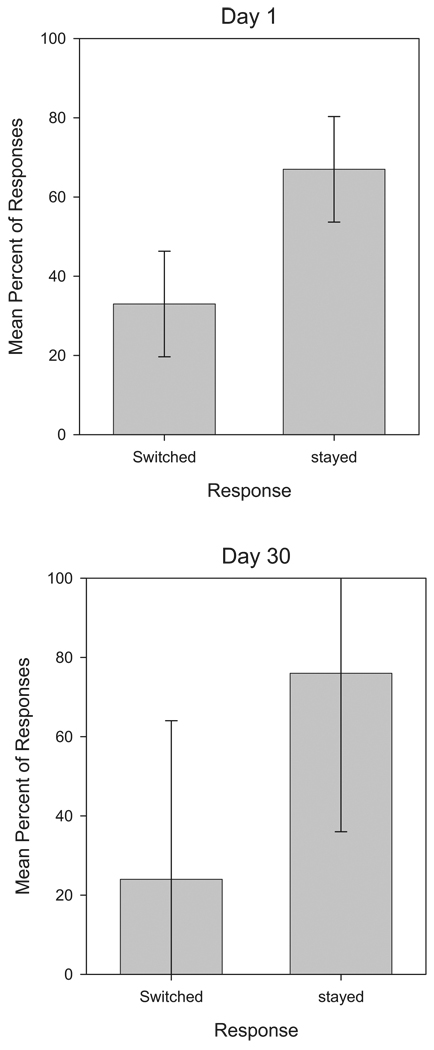
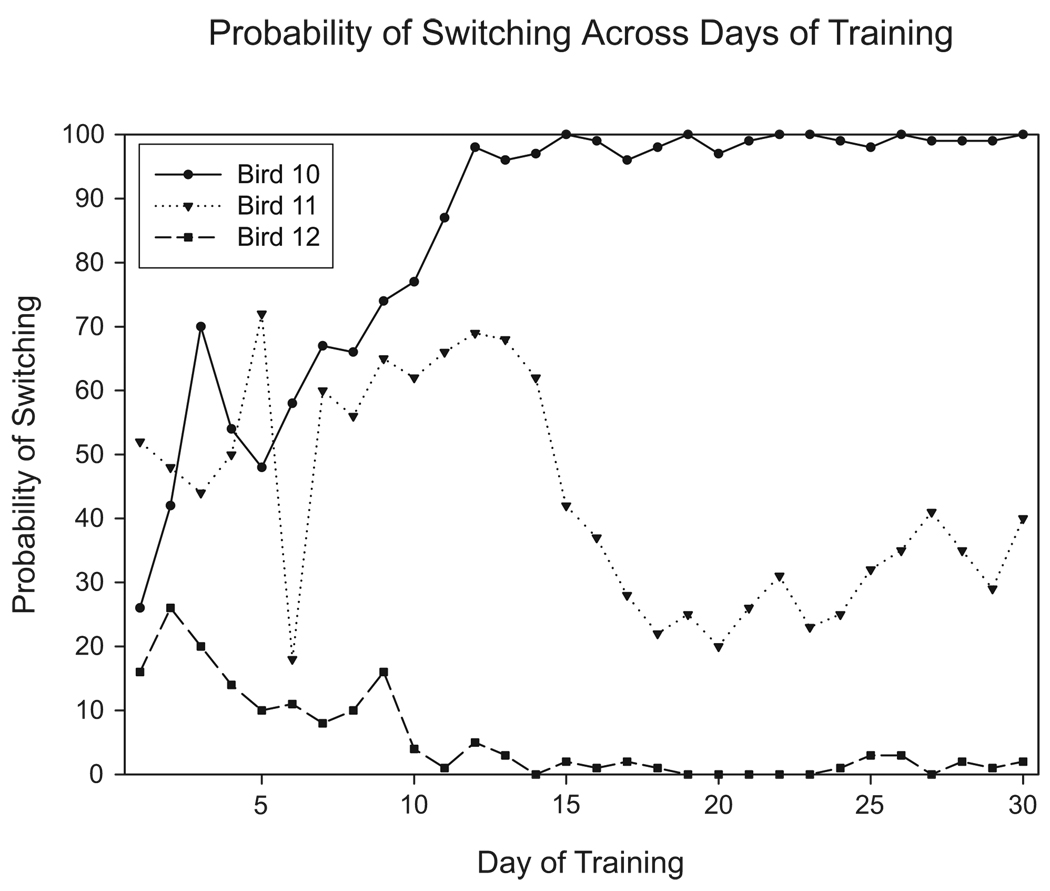
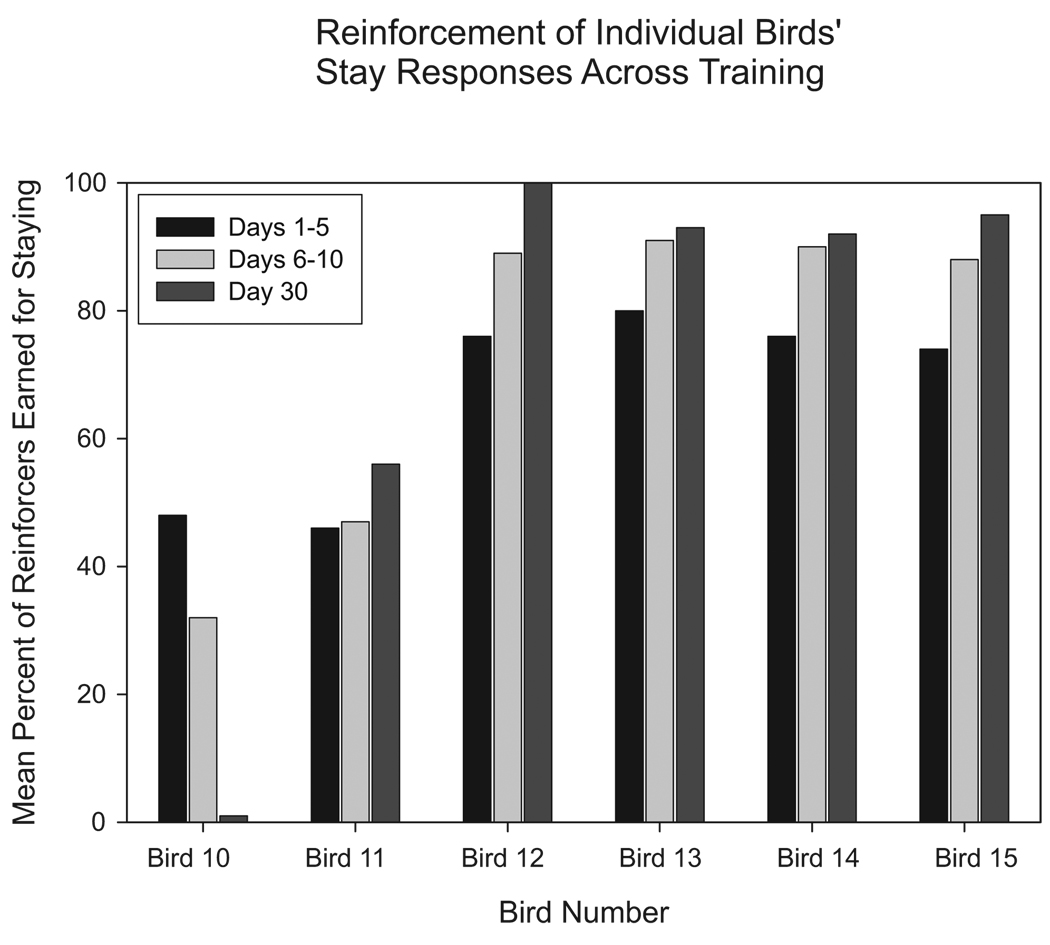
The "Monty Hall Dilemma" (MHD) is a well known probability puzzle in which a player tries to guess which of three doors conceals a desirable prize. After an initial choice is made, one of the remaining doors is opened, revealing no prize. The player is then given the option of staying with their initial guess or switching to the other unopened door. Most people opt to stay with their initial guess, despite the fact that switching doubles the probability of winning. A series of experiments investigated whether pigeons (Columba livia), like most humans, would fail to maximize their expected winnings in a version of the MHD. Birds completed multiple trials of a standard MHD, with the three response keys in an operant chamber serving as the three doors and access to mixed grain as the prize. Across experiments, the probability of gaining reinforcement for switching and staying was manipulated, and birds adjusted their probability of switching and staying to approximate the optimal strategy. Replication of the procedure with human participants showed that humans failed to adopt optimal strategies, even with extensive training.
Figures
Similar articles
-
The Monty Hall dilemma with pigeons: No, you choose for me.Learn Behav. 2015 Sep;43(3):209-16. doi: 10.3758/s13420-015-0172-3. Learn Behav. 2015. PMID: 25772336
-
Choice behavior of pigeons (Columba livia), college students, and preschool children (Homo sapiens) in the Monty Hall dilemma.J Comp Psychol. 2012 Nov;126(4):407-20. doi: 10.1037/a0028273. Epub 2012 May 14. J Comp Psychol. 2012. PMID: 22582816 Free PMC article.
-
Testing the limits of optimality: the effect of base rates in the Monty Hall dilemma.Learn Behav. 2014 Mar;42(1):69-82. doi: 10.3758/s13420-013-0126-6. Learn Behav. 2014. PMID: 24234041 Clinical Trial.
-
Why Humans Fail in Solving the Monty Hall Dilemma: A Systematic Review.Psychol Belg. 2018 Jun 1;58(1):128-158. doi: 10.5334/pb.274. Psychol Belg. 2018. PMID: 30479812 Free PMC article. Review.
-
Reasoning and choice in the Monty Hall Dilemma (MHD): implications for improving Bayesian reasoning.Front Psychol. 2015 Mar 31;6:353. doi: 10.3389/fpsyg.2015.00353. eCollection 2015. Front Psychol. 2015. PMID: 25873906 Free PMC article. Review.
Cited by
-
The Monty Hall dilemma with pigeons: No, you choose for me.Learn Behav. 2015 Sep;43(3):209-16. doi: 10.3758/s13420-015-0172-3. Learn Behav. 2015. PMID: 25772336
-
Disentangling Effects of Input Frequency and Morphophonological Complexity on Children's Acquisition of Verb Inflection: An Elicited Production Study of Japanese.Cogn Sci. 2018 May;42 Suppl 2(Suppl Suppl 2):555-577. doi: 10.1111/cogs.12554. Epub 2017 Oct 10. Cogn Sci. 2018. PMID: 29023860 Free PMC article.
-
Learning how to "make a deal": human (Homo sapiens) and monkey (Macaca mulatta) performance when repeatedly faced with the Monty Hall Dilemma.J Comp Psychol. 2013 Feb;127(1):103-8. doi: 10.1037/a0029057. Epub 2012 Jul 2. J Comp Psychol. 2013. PMID: 22746157 Free PMC article.
-
Choice behavior of pigeons (Columba livia), college students, and preschool children (Homo sapiens) in the Monty Hall dilemma.J Comp Psychol. 2012 Nov;126(4):407-20. doi: 10.1037/a0028273. Epub 2012 May 14. J Comp Psychol. 2012. PMID: 22582816 Free PMC article.
-
Negative outcomes evoke cyclic irrational decisions in Rock, Paper, Scissors.Sci Rep. 2016 Feb 4;6:20479. doi: 10.1038/srep20479. Sci Rep. 2016. PMID: 26843423 Free PMC article.
References
-
- Arkes HR, Ayton P. The sunk cost and Concorde effects: Are humans less rational than lower animals? Psychological Bulletin. 1999;125:591–600.
-
- Ashby FG, Maddox WT. Complex decision rules in categorization: Contrasting novice and experienced performance. Journal of Experimental Psychology: Human Perception and Performance. 1992;18(1):50–71.
-
- Bullock DH, Bitterman ME. Probability-matching in the pigeon. American Journal of Psychology. 1962;75:634–639. - PubMed
-
- Burns BD, Wieth M. The collider principle in causal reasoning: Why the Monty Hall dilemma is so hard. Journal of Experimental Psychology: General. 2004;133(3):434–449. - PubMed
