

A time-series analysis of clostridium difficile and its seasonal association with influenza
- PMID: 20175682
- PMCID: PMC3024857
- DOI: 10.1086/651095
A time-series analysis of clostridium difficile and its seasonal association with influenza
Abstract
Objective: To characterize the temporal progression of the monthly incidence of Clostridium difficile infections (CDIs) and to determine whether the incidence of CDI is related to the incidence of seasonal influenza.
Design: A retrospective study of patients in the Nationwide Inpatient Sample during the period from 1998 through 2005.
Methods: We identified all hospitalizations with a primary or secondary diagnosis of CDI with use of International Classification of Diseases, 9th Revision, Clinical Modification codes, and we did the same for influenza. The incidence of CDI was modeled as an autoregression about a linear trend. To investigate the association of CDI with influenza, we compared national and regional CDI and influenza series data and calculated cross-correlation functions with data that had been prewhitened (filtered to remove temporal patterns common to both series). To estimate the burden of seasonal CDI, we developed a proportional measure of seasonal CDI.
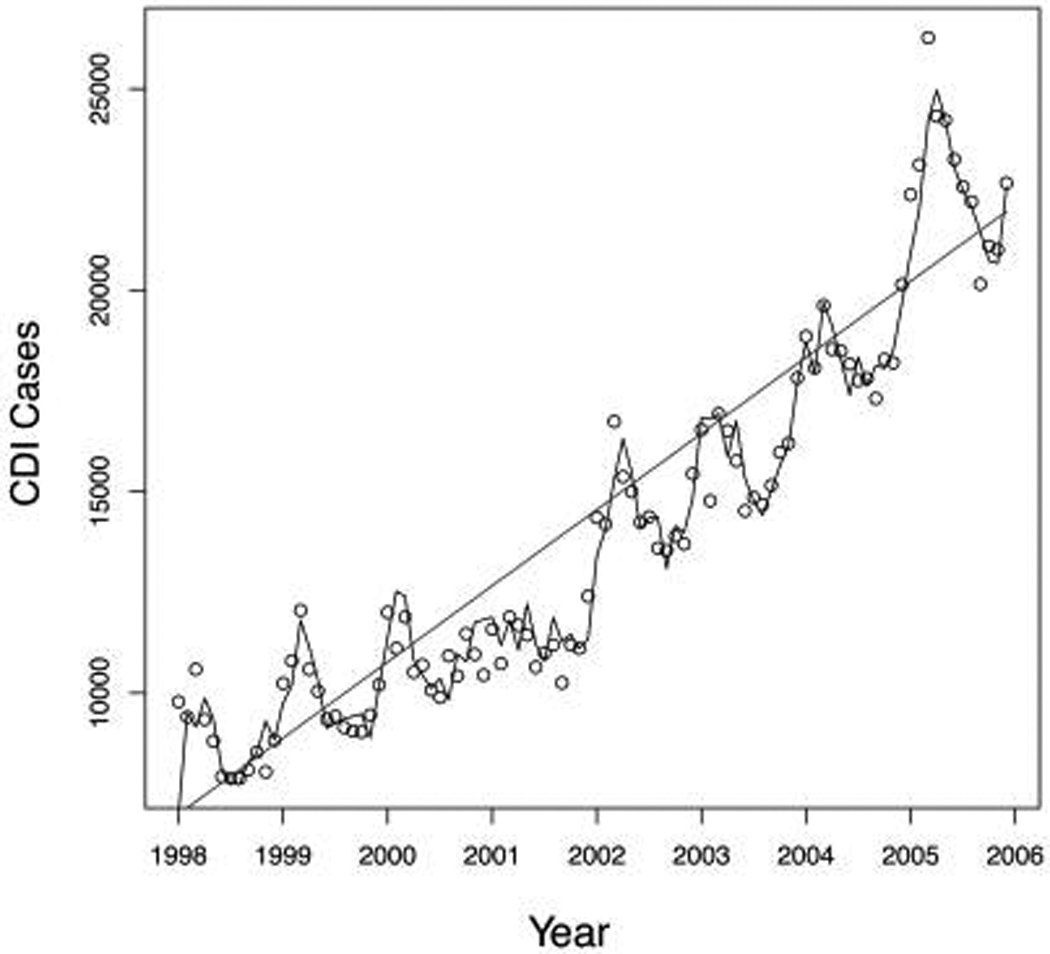
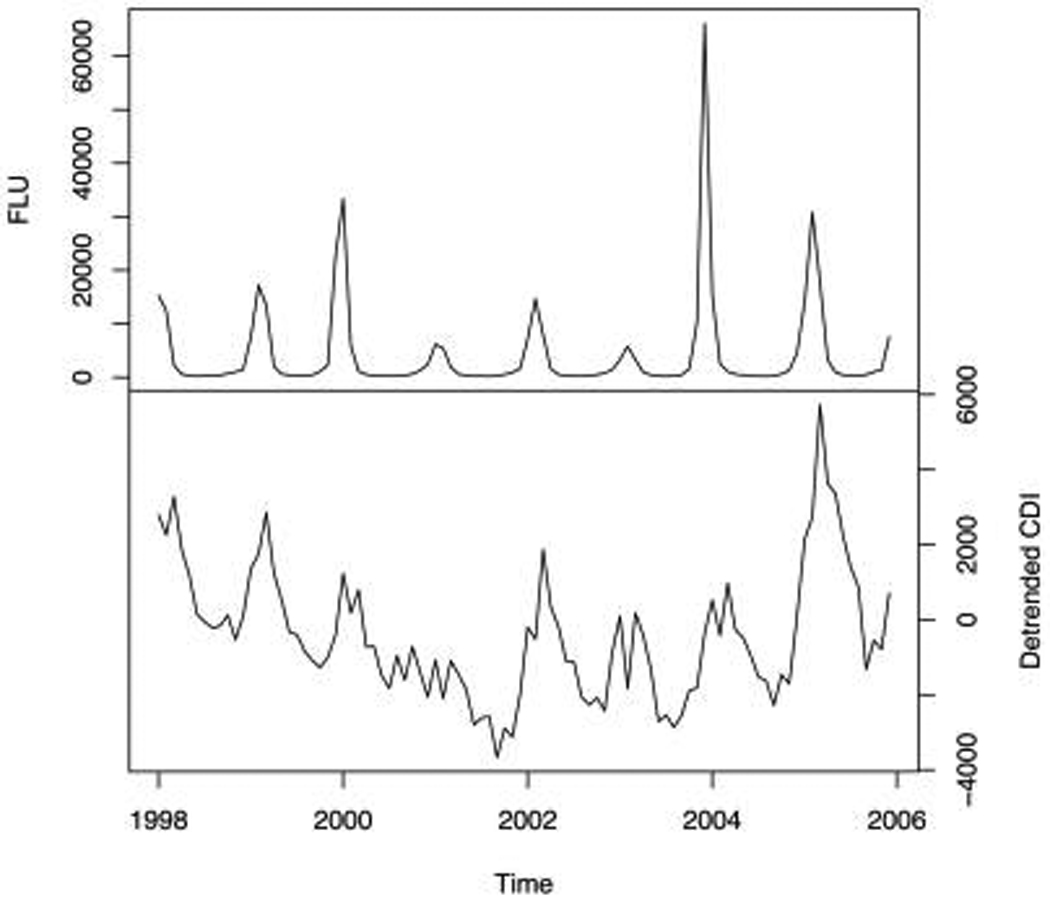
Results: Time-series analysis of the monthly number of CDI cases reveals a distinct positive linear trend and a clear pattern of seasonal variation (R2 = 0.98). The cross-correlation functions indicate that influenza activity precedes CDI activity on both a national and regional basis. The average burden of seasonal (ie, winter) CDI is 23%.
Conclusions: The epidemiologic characteristics of CDI follow a pattern that is seasonal and associated with influenza, which is likely due to antimicrobial use during influenza seasons. Approximately 23% of average monthly CDI during the peak 3 winter months could be eliminated if CDI remained at summer levels.
Conflict of interest statement
Figures
References
-
- Archibald LK, Banerjee SN, Jarvis WR. Secular trends in hospital-acquired Clostridium difficile disease in the United States, 1987–2001. J Infect Dis. 2004;189:1585–1589. - PubMed
-
- Chandler RE, Hedberg K, Cieslak PR. Clostridium difficile–associated disease in Oregon: increasing incidence and hospital-level risk factors. Infect Control Hosp Epidemiol. 2007;28:116–122. - PubMed
-
- Elixhauser A, Jhung M. HCUP Statistical Brief 50. Rockville, MD: Agency of Healthcare Research and Quality; 2008. Apr [Accessed January 30, 2009]. Clostridium difficile-associated disease in U.S. hospitals, 1993–2005. http://www.hcup-us.ahrq.gov/reports/statbriefs/sb50.pdf. - PubMed
Publication types
MeSH terms
Grants and funding
LinkOut - more resources
Full Text Sources
Medical