

Digital gene expression analysis of two life cycle stages of the human-infective parasite, Trypanosoma brucei gambiense reveals differentially expressed clusters of co-regulated genes
- PMID: 20175885
- PMCID: PMC2837033
- DOI: 10.1186/1471-2164-11-124
Digital gene expression analysis of two life cycle stages of the human-infective parasite, Trypanosoma brucei gambiense reveals differentially expressed clusters of co-regulated genes
Abstract
Background: The evolutionarily ancient parasite, Trypanosoma brucei, is unusual in that the majority of its genes are regulated post-transcriptionally, leading to the suggestion that transcript abundance of most genes does not vary significantly between different life cycle stages despite the fact that the parasite undergoes substantial cellular remodelling and metabolic changes throughout its complex life cycle. To investigate this in the clinically relevant sub-species, Trypanosoma brucei gambiense, which is the causative agent of the fatal human disease African sleeping sickness, we have compared the transcriptome of two different life cycle stages, the potentially human-infective bloodstream forms with the non-human-infective procyclic stage using digital gene expression (DGE) analysis.
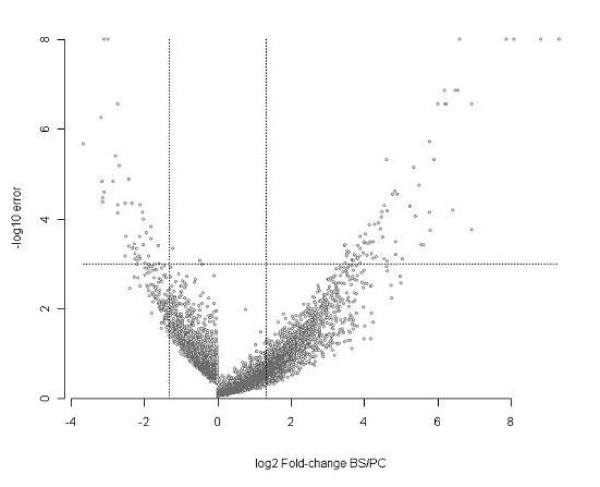
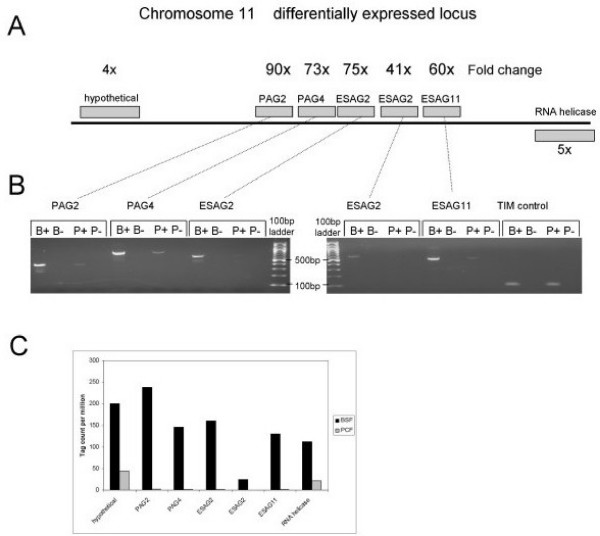
Results: Over eleven million unique tags were generated, producing expression data for 7360 genes, covering 81% of the genes in the genome. Compared to microarray analysis of the related T. b. brucei parasite, approximately 10 times more genes with a 2.5-fold change in expression levels were detected. The transcriptome analysis revealed the existence of several differentially expressed gene clusters within the genome, indicating that contiguous genes, presumably from the same polycistronic unit, are co-regulated either at the level of transcription or transcript stability.
Conclusions: DGE analysis is extremely sensitive for detecting gene expression differences, revealing firstly that a far greater number of genes are stage-regulated than had previously been identified and secondly and more importantly, this analysis has revealed the existence of several differentially expressed clusters of genes present on what appears to be the same polycistronic units, a phenomenon which had not previously been observed in microarray studies. These differentially regulated clusters of genes are in addition to the previously identified RNA polymerase I polycistronic units of variant surface glycoproteins and procyclin expression sites, which encode the major surface proteins of the parasite. This raises a number of questions regarding the function and regulation of the gene clusters that clearly warrant further study.
Figures
References
-
- Rochette A, Raymond F, Ubeda JM, Smith M, Messier N, Boisvert S, Rigault P, Corbeil J, Ouellette M, Papadopoulou B. Genome-wide gene expression profiling analysis of Leishmania major and Leishmania infantum developmental stages reveals substantial differences between the two species. BMC Genomics. 2008;9:255. doi: 10.1186/1471-2164-9-255. - DOI - PMC - PubMed
-
- Bozdech Z, Mok S, Hu G, Imwong M, Jaidee A, Russell B, Ginsburg H, Nosten F, Day NP, White NJ. et al. The transcriptome of Plasmodium vivax reveals divergence and diversity of transcriptional regulation in malaria parasites. Proc Natl Acad Sci USA. 2008;105(42):16290–16295. doi: 10.1073/pnas.0807404105. - DOI - PMC - PubMed
Publication types
MeSH terms
Substances
Grants and funding
LinkOut - more resources
Full Text Sources
Molecular Biology Databases
