

Expression of the leukemic prognostic marker CD7 is linked to epigenetic modifications in chronic myeloid leukemia
- PMID: 20175919
- PMCID: PMC2843654
- DOI: 10.1186/1476-4598-9-41
Expression of the leukemic prognostic marker CD7 is linked to epigenetic modifications in chronic myeloid leukemia
Abstract
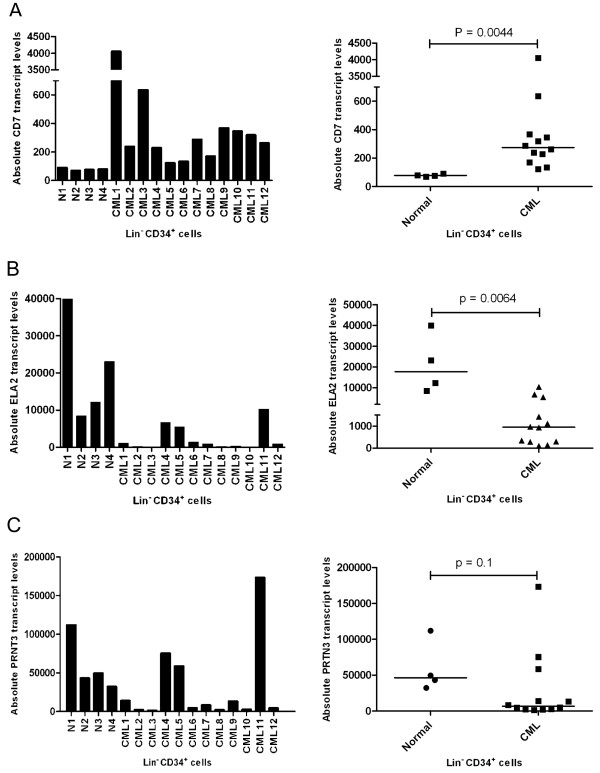
Background: Expression levels of the cell surface glycoprotein, CD7, and the serine protease, elastase 2 (ELA2), in the leukemic cells of patients with chronic myeloid leukemia (CML) have been associated with clinical outcome. However, little is known about the mechanisms that underlie the variable expression of these genes in the leukemic cells.
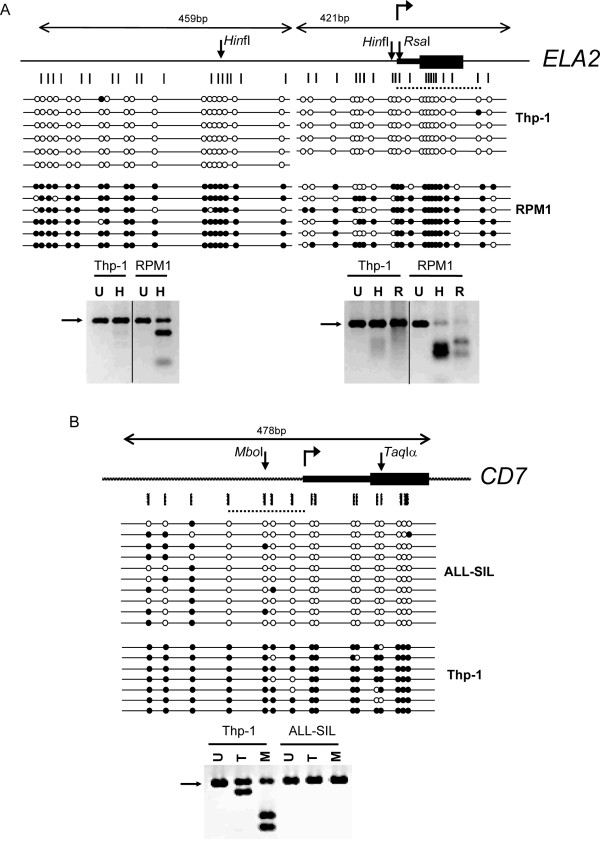
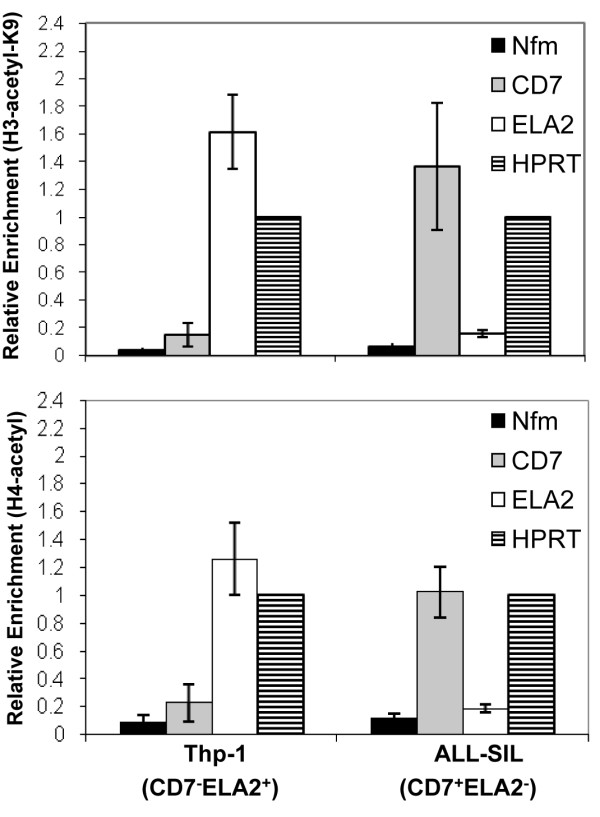
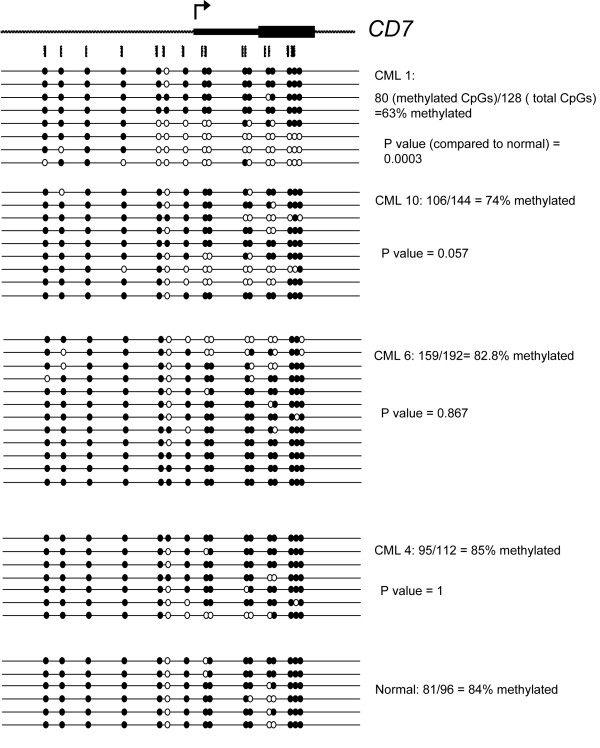
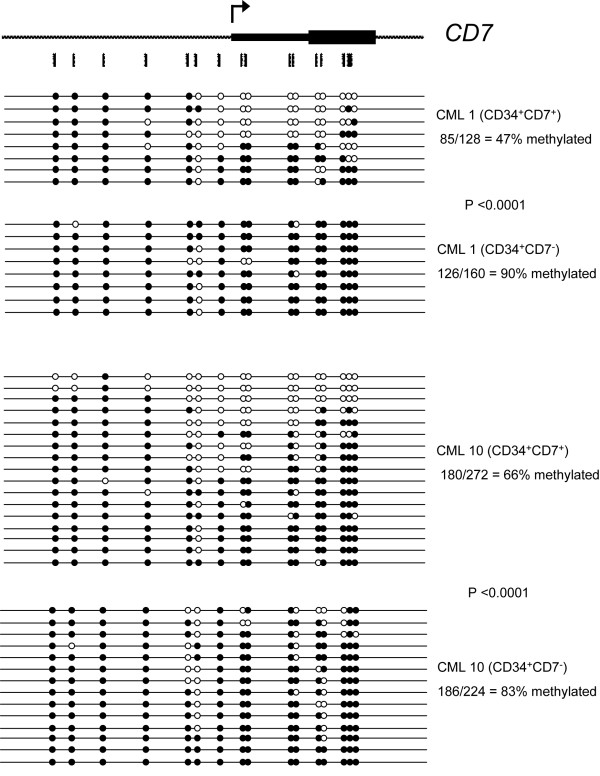
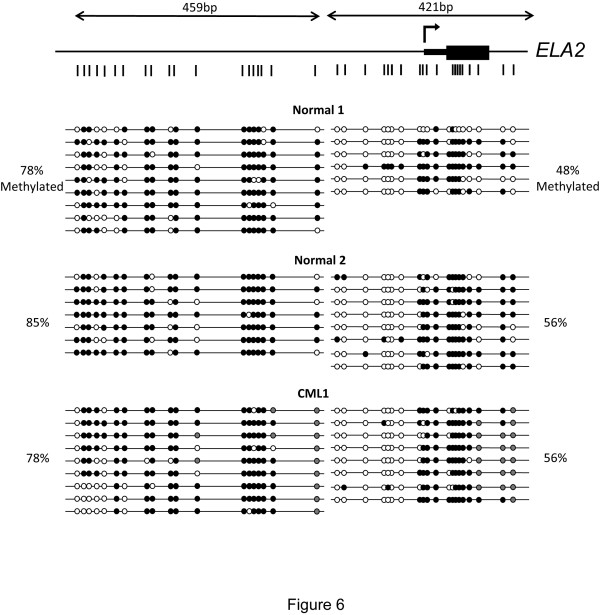
Results: To address this question, we compared the level of their expression with the DNA methylation and histone acetylation status of 5' sequences of both genes in leukemic cell lines and primitive (lin-CD34+) leukemic cells from chronic phase CML patients. DNA methylation of the ELA2 gene promoter did not correlate with its expression pattern in lin-CD34+ cells from chronic phase CML patient samples even though there was clear differential DNA methylation of this locus in ELA2-expressing and non-expressing cell lines. In contrast, we found a strong relation between CD7 expression and transcription-permissive chromatin modifications, both at the level of DNA methylation and histone acetylation with evidence of hypomethylation of the CD7 promoter region in the lin-CD34+ cells from CML patients with high CD7 expression.
Conclusion: These findings indicate a link between epigenetic modifications and CD7 expression in primitive CML cells.
Figures
Similar articles
-
CD34+CD7+ leukemic progenitor cells may be involved in maintenance and clonal evolution of chronic myeloid leukemia.Clin Cancer Res. 2005 Jan 15;11(2 Pt 1):505-11. Clin Cancer Res. 2005. PMID: 15701834
-
DNA methylation profiling reveals a pathological signature that contributes to transcriptional defects of CD34+ CD15- cells in early chronic-phase chronic myeloid leukemia.Mol Oncol. 2018 Jun;12(6):814-829. doi: 10.1002/1878-0261.12191. Epub 2018 Apr 27. Mol Oncol. 2018. PMID: 29575763 Free PMC article.
-
Hypomethylation-mediated H19 overexpression increases the risk of disease evolution through the association with BCR-ABL transcript in chronic myeloid leukemia.J Cell Physiol. 2018 Mar;233(3):2444-2450. doi: 10.1002/jcp.26119. Epub 2017 Aug 30. J Cell Physiol. 2018. PMID: 28776669
-
Epigenetic dysregulation in chronic myeloid leukaemia: A myriad of mechanisms and therapeutic options.Semin Cancer Biol. 2018 Aug;51:180-197. doi: 10.1016/j.semcancer.2017.07.006. Epub 2017 Aug 2. Semin Cancer Biol. 2018. PMID: 28778403 Review.
-
[New insight into DNA methylation in CML and its effect on clinical outcome--review].Zhongguo Shi Yan Xue Ye Xue Za Zhi. 2008 Dec;16(6):1482-6. Zhongguo Shi Yan Xue Ye Xue Za Zhi. 2008. PMID: 19099669 Review. Chinese.
Cited by
-
A new monoclonal antibody detects downregulation of protein tyrosine phosphatase receptor type γ in chronic myeloid leukemia patients.J Hematol Oncol. 2017 Jun 21;10(1):129. doi: 10.1186/s13045-017-0494-z. J Hematol Oncol. 2017. PMID: 28637510 Free PMC article.
-
Combinatory Flowcytometric Approach in Pediatric Acute Lymphoid Leukemia Identifies Surrogate Minimal Residual Disease Markers.Diagnostics (Basel). 2025 Mar 8;15(6):658. doi: 10.3390/diagnostics15060658. Diagnostics (Basel). 2025. PMID: 40150002 Free PMC article.
-
Integrative analysis of DNA copy number, DNA methylation and gene expression in multiple myeloma reveals alterations related to relapse.Oncotarget. 2016 Dec 6;7(49):80664-80679. doi: 10.18632/oncotarget.13025. Oncotarget. 2016. PMID: 27811368 Free PMC article.
-
Decoding the Immune Microenvironment of Clear Cell Renal Cell Carcinoma by Single-Cell Profiling to Aid Immunotherapy.Front Immunol. 2022 Jun 24;13:791158. doi: 10.3389/fimmu.2022.791158. eCollection 2022. Front Immunol. 2022. PMID: 35812372 Free PMC article.
-
Using an exon microarray to identify a global profile of gene expression and alternative splicing in K562 cells exposed to sodium valproate.Oncol Rep. 2012 Apr;27(4):1258-65. doi: 10.3892/or.2011.1601. Epub 2011 Dec 21. Oncol Rep. 2012. PMID: 22200904 Free PMC article.
References
-
- Bartram CR, de Klein A, Hagemeijer A, van Agthoven T, Geurts van Kessel A, Bootsma D, Grosveld G, Ferguson-Smith MA, Davies T, Stone M. Translocation of c-ab1 oncogene correlates with the presence of a Philadelphia chromosome in chronic myelocytic leukaemia. Nature. 1983;306:277–280. doi: 10.1038/306277a0. - DOI - PubMed
Publication types
MeSH terms
Substances
LinkOut - more resources
Full Text Sources
Other Literature Sources
Medical
