. 2010 Jun-Jul;1797(6-7):865-77.
doi: 10.1016/j.bbabio.2010.02.016. Epub 2010 Feb 20.

Redox-optimized ROS balance: a unifying hypothesis

Affiliations

Redox-optimized ROS balance: a unifying hypothesis

M A Aon et al. Biochim Biophys Acta. 2010 Jun-Jul.

Abstract

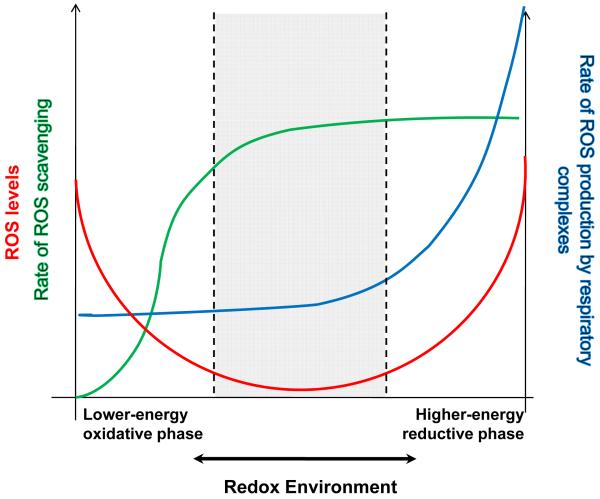
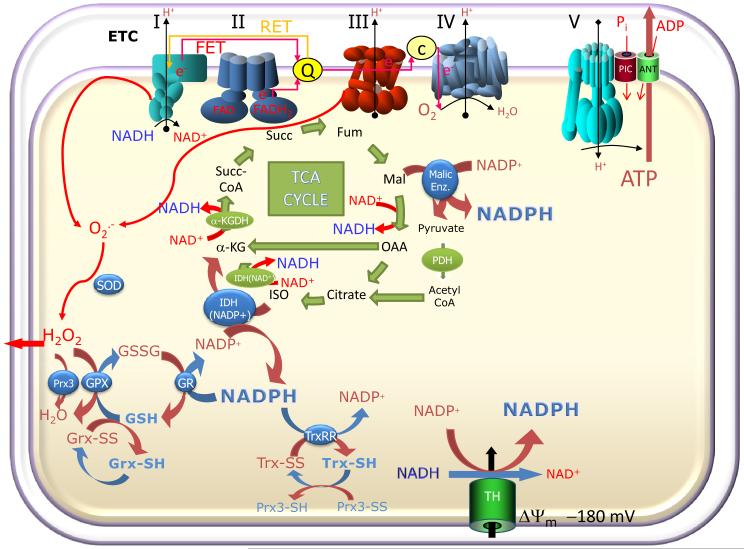
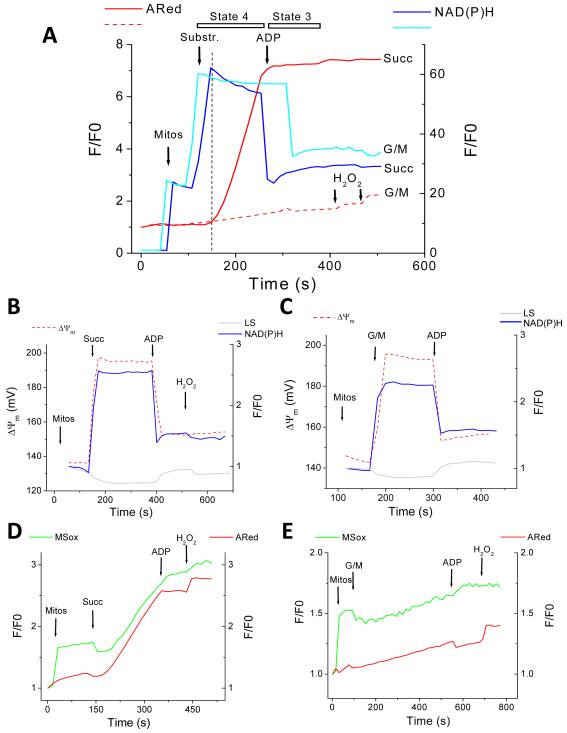
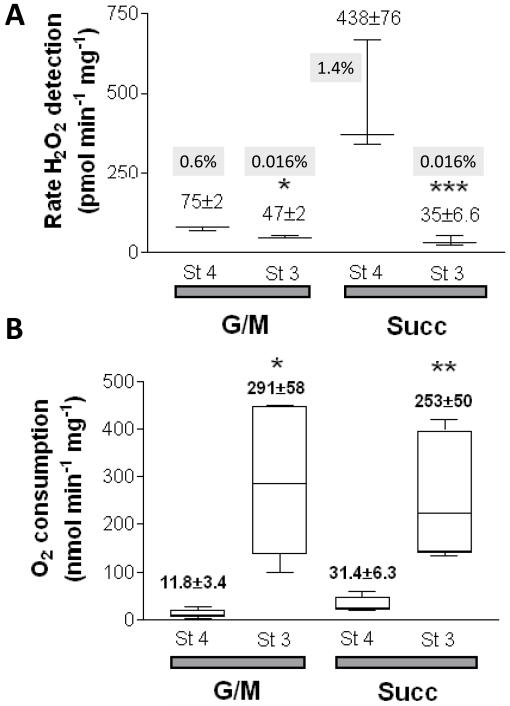
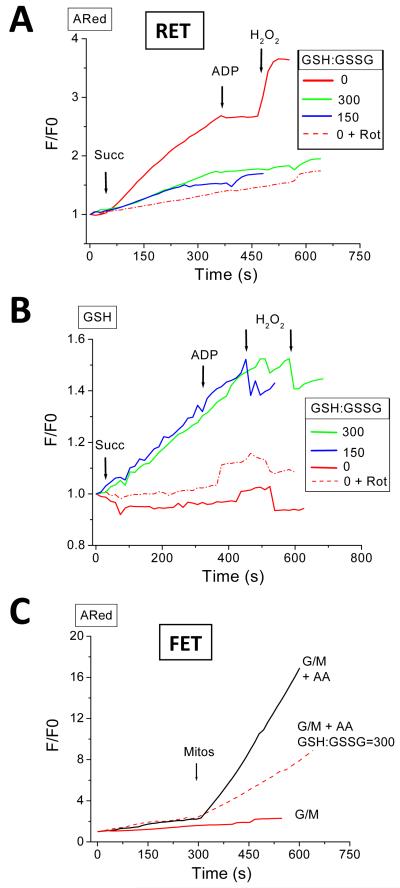
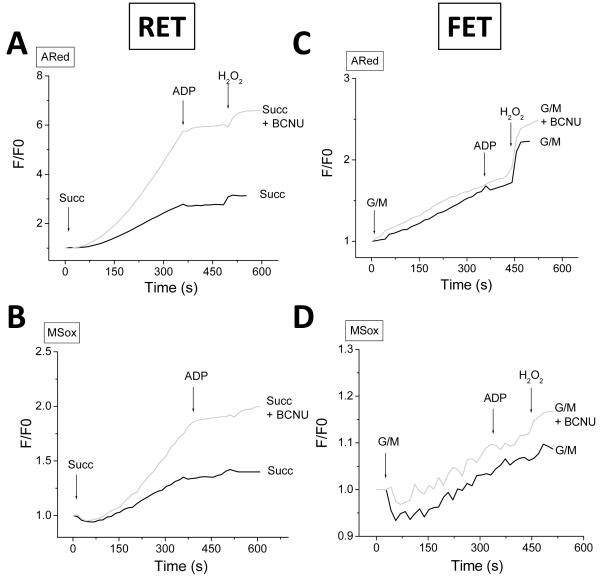
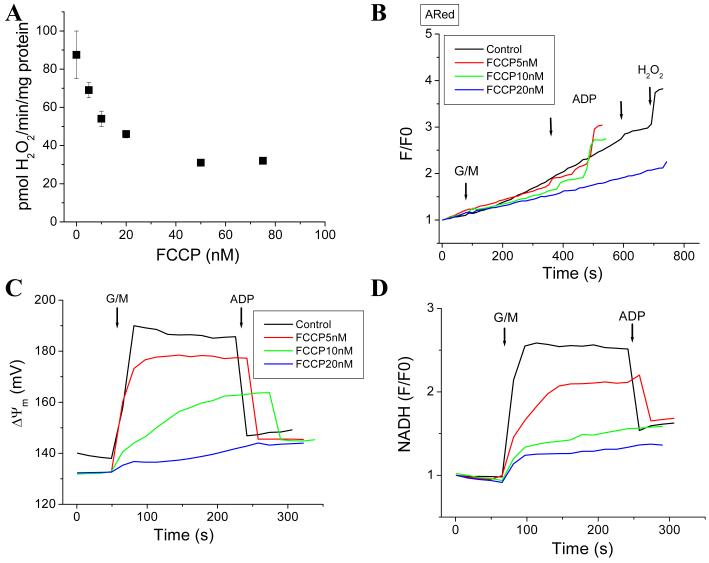
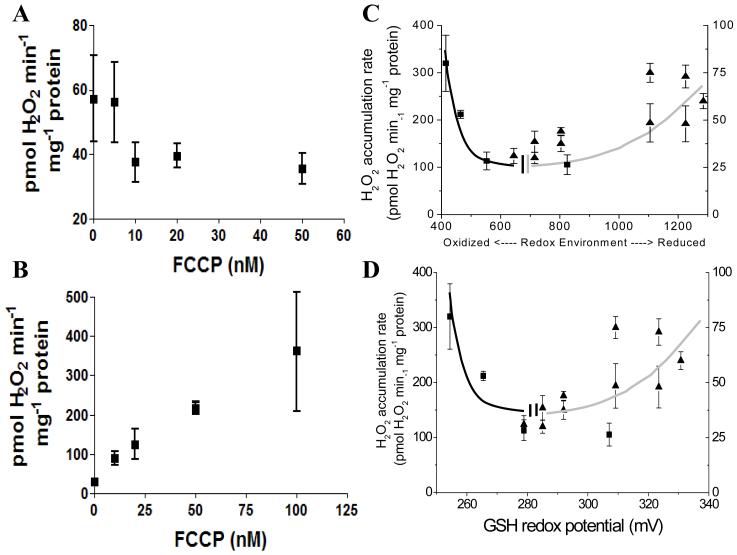
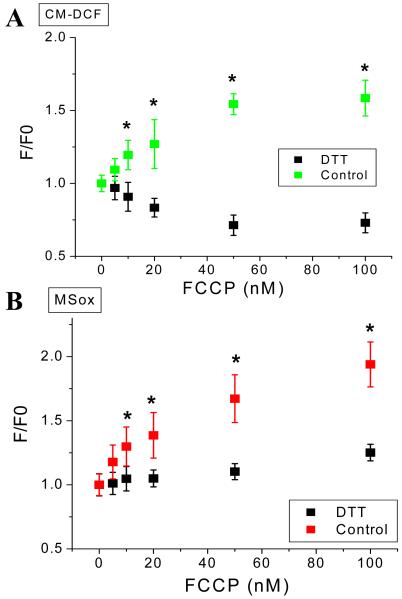
While it is generally accepted that mitochondrial reactive oxygen species (ROS) balance depends on the both rate of single electron reduction of O2 to superoxide (O2.-) by the electron transport chain and the rate of scavenging by intracellular antioxidant pathways, considerable controversy exists regarding the conditions leading to oxidative stress in intact cells versus isolated mitochondria. Here, we postulate that mitochondria have been evolutionarily optimized to maximize energy output while keeping ROS overflow to a minimum by operating in an intermediate redox state. We show that at the extremes of reduction or oxidation of the redox couples involved in electron transport (NADH/NAD+) or ROS scavenging (NADPH/NADP+, GSH/GSSG), respectively, ROS balance is lost. This results in a net overflow of ROS that increases as one moves farther away from the optimal redox potential. At more reduced mitochondrial redox potentials, ROS production exceeds scavenging, while under more oxidizing conditions (e.g., at higher workloads) antioxidant defenses can be compromised and eventually overwhelmed. Experimental support for this hypothesis is provided in both cardiomyocytes and in isolated mitochondria from guinea pig hearts. The model reconciles, within a single framework, observations that isolated mitochondria tend to display increased oxidative stress at high reduction potentials (and high mitochondrial membrane potential, Psim), whereas intact cardiac cells can display oxidative stress either when mitochondria become more uncoupled (i.e., low Psim) or when mitochondria are maximally reduced (as in ischemia or hypoxia). The continuum described by the model has the potential to account for many disparate experimental observations and also provides a rationale for graded physiological ROS signaling at redox potentials near the minimum.


Figures

Figure 1
Figure 1. The Redox-optimized ROS balance hypothesis
The plot illustrates that the extent of ROS imbalance is defined by the overall intracellular and intramitochondrial redox environments (see text and Fig. 2). Physiological ROS signaling (denoted between dashed lines) occurs within a range close to the minimum of the overall (red) curve that corresponds to intermediate values of the redox environment. Oxidative stress can happen at either extreme of redox potential, that is, when the intracellular and/or intramitochondrial environments are either highly reduced or highly oxidized. Away from the minimum, the extent of ROS overflow in the system is governed by completely different mechanisms at the two redox extremes. Under a more reduced redox environment (towards the right hand side of the plot), ROS overflow increases because ROS (O2.−, H2O2) production (blue line) will be favored, exceeding the scavenger capacity, even though the latter is at its maximum level (green line). At more oxidized redox potentials (left hand side), ROS overflow occurs as a consequence of depletion of the ROS scavengers pool. See text for further details.
Figure 2
Figure 2. Moiety-conserved redox cycles linking metabolic and antioxidant pathways in mitochondria
O2.− produced by the mitochondrial electron transport chain through reverse- or forward-electron transport (RET or FET) is dismutated to H2O2 by superoxide dismutase (SOD). The reduced redox environment is controlled by several systems, including the large capacity glutathione system (GSH, GSSG), the glutaredoxin (Grx) system, and the thioredoxin (Trx) system, responsible for the reduction of selected protein targets such as peroxiredoxin (Prx) and ribonucleotide reductase. GSH and Trx are both essential for the detoxification of H2O2 via glutathione peroxidase (GPX) and Prx enzymes, respectively. Mitochondrial catalase may also contribute to H2O2 scavenging (not shown). Different isoforms of these enzymes are present in the cytosol and in the mitochondrial matrix; however, in both compartments, their redox state depends on maintaining the negative reduction potential of NADPH (> −350 mV). The NADPH/NADP+ redox couple is, in turn, kept in the reduced state through the metabolic pathways of the cell through a close relationship between oxidative metabolism, electron transport, and antioxidants. In the matrix, three major enzymes involved in NADPH regeneration are the NAD(P) transhydrogenase (TH; which catalyzes the transfer of electrons between NADH and NADP+ at the expense of the protonmotive force), the NADP+-dependent isocitrate dehydrogenase (IDH-NADP+) and Malic enzyme; the latter two are dependent on TCA cycle intermediates. Hence, any change in oxidative phosphorylation could also affect the antioxidant pathways.
Figure 3
Figure 3. ROS balance under FET and RET
Simultaneous monitoring of mitochondrial ROS (H2O2 with ARed, and O2.− with MitoSOX; MSox), ΔΨm, and NAD(P)H, during state 4 and the state 4→state 3 transition in freshly isolated guinea-pig heart mitochondria. The forward mode (FET) of electron transport occurs in the presence of the NAD+-linked substrates glutamate/malate (G/M, continuous lines) whereas reverse electron flow (RET) happens with succinate (Succ, dashed lines)-supported respiration (see text and Methods for further details). A) Isolated mitochondria were resuspended (100-200μg mitochondrial protein) in the cuvette of a spectrofluorometer containing 2ml isosmotic 137mM KCl-based assay medium in the presence of Ared with constant stirring at 37°C (see Methods). At the indicated times, 5mM glutamate-K+/malate-Na+ or 5mM Succ (first arrow), or 1mM ADP (second arrow), were added. NAD(P)H and ROS recordings are shown. Mitochondrial ROS overflow is negligible with G/M (dashed line) but Succ (continuous line) triggers a robust increase in measured H2O2 by ARed. Notice the similar degree of NAD(P)H reduction both under FET and RET, and that H2O2 starts to increase after the maximal degree of NAD(P)H reduction is attained (vertical dashed line). At the end of the experiment 50nM H2O2 is always added for calibration purposes as well as determining that the ARed system is active under the specified conditions. B, C) Represented are ΔΨm, NAD(P)H, and 90° light scattering, with mitochondria analyzed under similar conditions as in panel A. Notice that on substrate addition, mitochondria respond with low-amplitude swelling (gray trace), ΔΨm polarization by ~40mV (dashed red trace) and a 2-2.5-fold NAD(P)H pool reduction (blue trace) whereas ADP addition has the opposite effect, i.e., a volume decrease, ΔΨm depolarization, and NAD(P)H oxidation (see text for further details). D, E) MitoSOX-loaded mitochondria (see Methods) were analyzed with the same protocol described in panel A in the presence of Ared under RET (D) or FET (E). Notice the parallel increase of O2.− (MSox) in the matrix, and extra-mitochondrial H2O2 (ARed). Key to abbreviations: MSox, MitoSOX; ARed, Amplex Red; G/M, glutamate/malate; Succ, succinate; Mitos, mitochondria.
Figure 4
Figure 4. Rates of ROS production and O2 consumption under FET and RET
Freshly isolated mitochondria from guinea pig heart were resuspended and analyzed as described in Methods and the legend of Fig. 3. A) Under FET (G/M) and RET (Succ), H2O2 and several other bioenergetic variables (e.g. ΔΨm, NAD(P)H) were monitored simultaneously with a spectrofluorometer (see legend Fig. 3 and Methods). B) In parallel, and under similar conditions, O2 measurements were performed. Mitochondrial respiration was measured in state 3 (St3) and state 4 (St4). Shown are the results obtained with H2O2 (A) and O2 (B) specific fluxes. The numbers in grey represent the H2O2 detected as a percentage of the O2 consumed (see Methods). The number of samples, n, analyzed was n=4 (2 experiments) and n=6 (2 experiments) for panels A and B, respectively. * p<0.05; ** p<0.01; *** p<0.001.
Figure 5
Figure 5. Effect of the exogenous GSH:GSSG ratio on the mitochondrial ROS balance under FET and RET
Freshly isolated mitochondria from guinea pig heart were loaded with the GSH fluorescent reporter MCB, and preincubated at a fixed GSH:GSSG ratio of 300 or 150 in the extra-mitochondrial space. The GSH:GSSG ratio was varied by changing the GSSG concentration while keeping GSH constant at 3mM. Mitochondria were analyzed as described in the legend of Fig. 3 under RET (A, B) and FET (C). The complex I origin of ROS under RET was ascertained by preincubating mitochondria with 1μM rotenone. Under FET, mitochondrial ROS production was analyzed in the presence of 5μM antimycin A. Shown are the results obtained in a representative experiment. A, C) Notice the decrease in ROS levels detected in the presence of GSH:GSSG either under RET or FET (in pmol H2O2 min−1 mg−1 protein (±SEM, n=3, 2 experiments): Succ: Control=666±62, GSH:GSSG(300:1)=420±31; G/M: Control=104±9, AA=687±53, GSH:GSSG(300:1)+ AA=414±22), and (B) the increase in intramitochondrial GSH. Key to symbols: AA, antimycin A; Rot, rotenone.
Figure 6
Figure 6. Effect of inhibiting intramitochondrial GSH regeneration on the mitochondrial ROS balance under FET and RET
Freshly isolated mitochondria from guinea pig heart, preloaded with 4μM MitoSOX, were preincubated with 100μM BCNU (carmustine), an inhibitor of glutathione reductase, and analyzed as described in the legend of Fig. 3, in the presence of ARed, both under RET (A, B) and FET (C, D).
Figure 7
Figure 7. Dynamic response of the mitochondrial ROS balance to pulses of H2O2 under FET
Freshly isolated mitochondria from guinea pig heart, preloaded with 20μM MCB, were subjected to pulses of H2O2 at the indicated concentrations, under FET. GSH (A) and NAD(P)H (B) redox pools were monitored simultaneously without (grey trace) or with ARed (black trace), at state 4 respiration in the presence of 5mM G/M or state 3 respiration after addition of 1mM ADP. Notice the relatively lower extent of oxidation of GSH and NAD(P)H redox pools in the presence of ARed, which acts as an H2O2 scavenging system (see the increase photon counts exhibited in the dashed trace of panel A after each H2O2 pulse). Key to symbols: MCBwARed, MCB-loaded mitochondria in the presence of ARed; MCBwoARed, MCB-loaded mitochondria in the absence of ARed; NADHwAred, mitochondria in the presence of ARed; NADHwoAred, mitochondria in the absence of ARed.
Figure 8
Figure 8. Mitochondrial ROS under mild uncoupling in freshly isolated cardiomyocytes from guinea pig heart
Freshly isolated cardiomyocytes from guinea pig heart were loaded with the ROS probes MitoSOX (A) and CM-H2DCFDA (B), and imaged with two photon laser scanning fluorescence microscopy as described in Methods. After baseline imaging of cells perfused with tyrode pH 7.5 containing 1mM Ca2+ and 10mM glucose, the indicated nanomolar concentrations of the protonophore FCCP were added. After 5min incubation with FCCP, images were taken every 2min, for a total of 11min in the presence of each FCCP concentration, after which the FCCP was washed out. This experimental protocol allowed us to discern whether the effect of FCCP on mitochondrial ROS was steady, and at the same time allowed us to obtain triplicate fluorescence determinations. All observations were paired, i.e., performed in the same cells at all uncoupler concentrations, for all the experiments. Although most of the cardiomyocytes survived the FCCP treatment, some cells exhibited hypercontracture and death as expected from depletion of cytoplasmic ATP levels (see Fig. S4 from Supplementary Material). Panel C shows the results obtained from three independent experiments with n=9 for each FCCP concentration and fluorescent probe. The fluorescence measurements corresponding to cells undergoing hypercontracture were not considered in the statistics, since the increase in fluorescence would be an artifact resulting from changes in cell shape.
Figure 9
Figure 9. ROS decreases in isolated mitochondria from guinea pig heart subjected to mild uncoupling
Freshly isolated mitochondria from guinea pig hearts were assayed as described in the legend of Figure 3 under FET at state 4 and 3 of respiration according to additions indicated by arrows. The experiment was performed either by preincubating the mitochondria with FCCP and triggering ROS production with the substrate, or by successive addition of different concentrations of the uncoupler after energization with substrate. In panel A, the FCCP dose-response curve for mitochondrial ROS is shown for successive additions of the uncoupler (n=4 for each data point, 2 experiments), whereas in panel B, the raw ARed traces obtained after preincubating the mitochondria with the indicated FCCP concentrations is shown. Panels C and D show the behavior of ΔΨm and NAD(P)H, respectively, for the same experiment shown in panel B.
Figure 10
Figure 10. Mild uncoupling can increase or decrease mitochondrial ROS depending on the redox environment in isolated mitochondria from guinea pig heart
Freshly isolated mitochondria from guinea pig heart loaded with 20μM monochlorobimane (MCB) (A) or higher (B) were uncoupled with the indicated concentration of FCCP under FET (5mM G/M) and state 4 respiration. A similar experiment to that reported in Figure 9A and 9B is shown in panel A (n=4 for each data point; 2 experiments), while in panel B represented are the results obtained with mitochondria loaded with 50μM or 100μM MCB, preincubated with 500nM H2O2, and then subjected to increasing dose of FCCP (n=4 for each data point; 2 experiments). Higher concentrations of MCB (>20μM) were utilized to titrate the mitochondrial GSH pool, and further compromise the antioxidant defenses. C, D) Panels A and B plot the results as a function of the redox environment for either the NADH/NAD+ and GSH/GSSG redox couples, calculated according to Eq. 1 (C), or the GSH/GSSG redox potential (D) obtained from Eq. 2. Squares and triangles in panels C and D correspond to the specific rates of H2O2 detection measured in panels A and B, respectively, as a function of the redox environment. The redox potential of the NADH/NAD+ and GSH/GSSG redox couples in mitochondria was calculated according to Eqs. 2 and 3 from the results obtained with mitochondria loaded with MCB, recorded simultaneously with NADH as a function of increasing concentrations of FCCP. Notice the agreement of the general shape of the curves in panels C and D with the one predicted by the Redox-optimized ROS balance hypothesis shown in Figure 1
Figure 11
Figure 11. Mild uncoupling can increase or decrease mitochondrial ROS depending on the redox environment in isolated cardiomyocytes from guinea pig heart
Freshly isolated cardiomyocytes from guinea pig heart were handled, and loaded with the ROS probes CM-H2DCFDA (A) and MitoSOX (B) and imaged with two photon scanning laser fluorescence microscopy as described in Methods and the legend of Figure 8. After baseline imaging of cells in the absence or the presence of 1mM or 2mM dithiothreitol (DTT) perfused with tyrode pH 7.5 containing 1mM Ca2+ and 10mM glucose, the indicated nanomolar concentrations of the protonophore FCCP were added. Identical imaging protocol to that described in Figure 8 was followed in the FCCP dose response. Data for control or DTT pretreated cells were paired, i.e. performed in the same cells at all uncoupler concentrations, all throughout the experiment (n=6 for each FCCP concentration; 2 experiments). * p < 0.05.

Similar articles

Cited by

References

    1. Balaban RS, Nemoto S, Finkel T. Mitochondria, oxidants, and aging. Cell. 2005;120:483–495. - PubMed
    1. Harman D. Aging: a theory based on free radical and radiation chemistry. J Gerontol. 1956;11:298–300. - PubMed
    1. Pearl R. The Rate of Living. University of London Press; London: 1928.
    1. Kelley R, Ideker T. Genome-wide fitness and expression profiling implicate Mga2 in adaptation to hydrogen peroxide. PLoS Genet. 2009;5:e1000488. - PMC - PubMed
    1. Lin SJ, Kaeberlein M, Andalis AA, Sturtz LA, Defossez PA, Culotta VC, Fink GR, Guarente L. Calorie restriction extends Saccharomyces cerevisiae lifespan by increasing respiration. Nature. 2002;418:344–348. - PubMed

Publication types

MeSH terms

LinkOut - more resources