. 2010 Jun;38(11):3555-69.
doi: 10.1093/nar/gkq064. Epub 2010 Feb 21.

Mycobacterium tuberculosis nucleoid-associated DNA-binding protein H-NS binds with high-affinity to the Holliday junction and inhibits strand exchange promoted by RecA protein

Affiliations

Mycobacterium tuberculosis nucleoid-associated DNA-binding protein H-NS binds with high-affinity to the Holliday junction and inhibits strand exchange promoted by RecA protein

N Sharadamma et al. Nucleic Acids Res. 2010 Jun.

Abstract

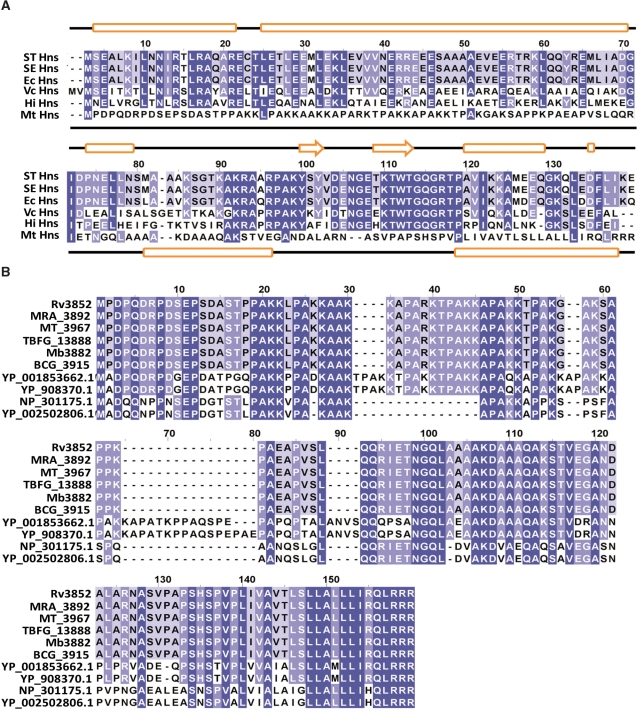
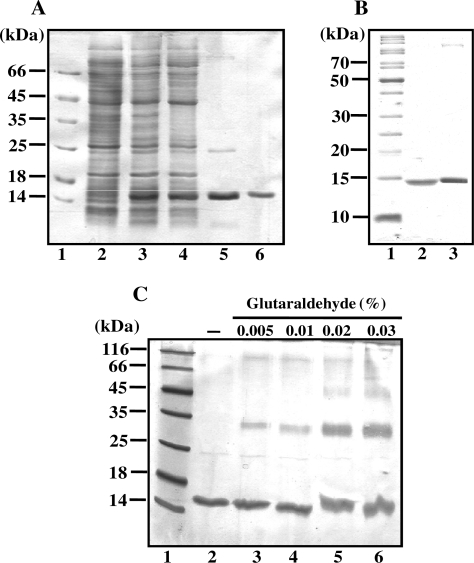
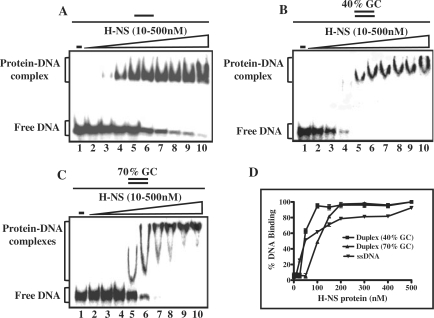
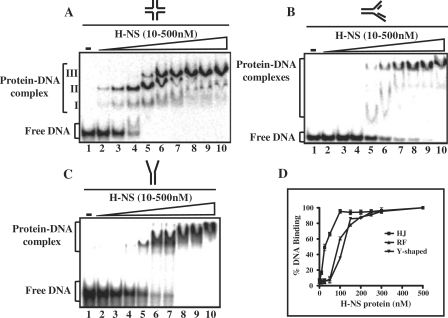
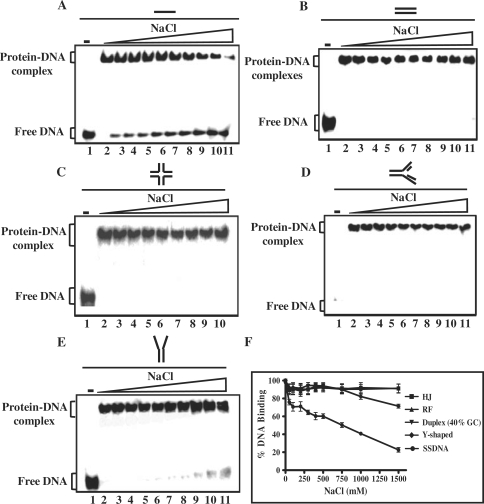
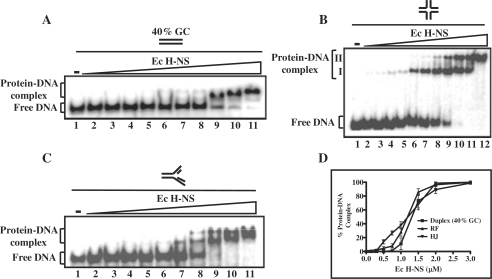
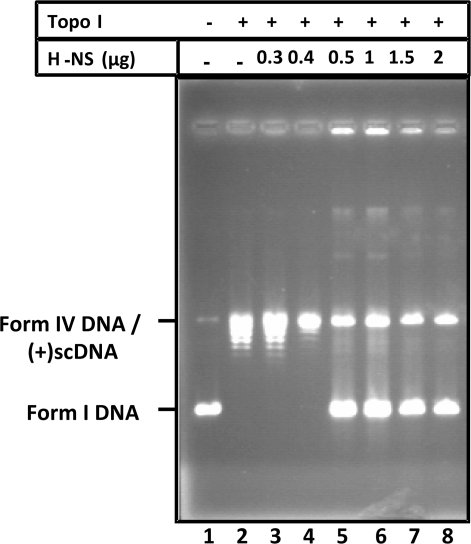
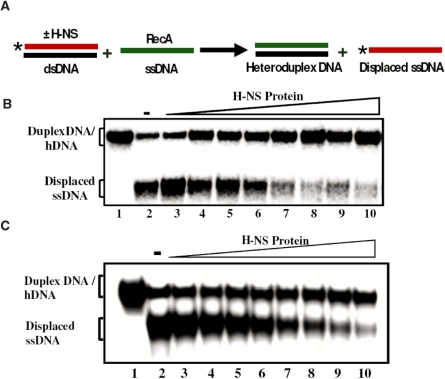
A number of studies have shown that the structure and composition of bacterial nucleoid influences many a processes related to DNA metabolism. The nucleoid-associated proteins modulate not only the DNA conformation but also regulate the DNA metabolic processes such as replication, recombination, repair and transcription. Understanding of how these processes occur in the context of Mycobacterium tuberculosis nucleoid is of considerable medical importance because the nucleoid structure may be constantly remodeled in response to environmental signals and/or growth conditions. Many studies have concluded that Escherichia coli H-NS binds to DNA in a sequence-independent manner, with a preference for A-/T-rich tracts in curved DNA; however, recent studies have identified the existence of medium- and low-affinity binding sites in the vicinity of the curved DNA. Here, we show that the M. tuberculosis H-NS protein binds in a more structure-specific manner to DNA replication and repair intermediates, but displays lower affinity for double-stranded DNA with relatively higher GC content. Notably, M. tuberculosis H-NS was able to bind Holliday junction (HJ), the central recombination intermediate, with substantially higher affinity and inhibited the three-strand exchange promoted by its cognate RecA. Likewise, E. coli H-NS was able to bind the HJ and suppress DNA strand exchange promoted by E. coli RecA, although much less efficiently compared to M. tuberculosis H-NS. Our results provide new insights into a previously unrecognized function of H-NS protein, with implications for blocking the genome integration of horizontally transferred genes by homologous and/or homeologous recombination.


Figures

Figure 1.
Figure 1.
ClustalW alignment of H-NS homologues from various bacterial species. (A) Alignment of amino acid sequences of H-NS homologues include the following: STHns, S. typhimurium LT2 SGSC1412 Hns (STM1751), SEHns, S. enterica serovar Typhi Ty2 Hns (t1662), EcHns, Escherichia coli Hns (b1237), VcHns, V. cholerae El Tor N16961 Hns (VC1130), HiHns, Haemophilus influenzae 86028NP (NTHI1464) and MtHns, Mycobacterium tuberculosis H37Rv Hns (Rv3852). Dark blue shading indicates identical amino acid residues; whereas, light blue indicates identical residues among the specified species. Secondary structure assignments for E. coli and M. tuberculosis H37Rv Hns proteins were carried out using the Jpred program (75) (http://www.compbio.dundee.ac.uk/∼www-jpred/) and are displayed above and below the alignments, respectively. The predicted secondary structures (cylinders represent alpha helices, arrows represent beta strands and lines represent loops, respectively) of E. coli and M. tuberculosis H-NS are shown at the top and bottom of the plot, respectively. (B) Amino acid sequences of M. tuberculosis H37Rv Hns (Rv3852), M. tuberculosis H37Ra Hns (MRA_3892), M. tuberculosis CDC1551 Hns (MT_3967), M. tuberculosis F11 Hns (TBFG_13888), M. bovis subsp. bovis AF2122/97 Hns (Mb3882), M. bovis BCG str. Pasteur 1173P2 Hns (BCG_3915), M. marinum M Hns(YP_001853662.1), M. ulcerans Agy99 Hns (YP_908370.1), M. leprae TN Hns (NP_301175.1) and M. leprae Br4923 Hns (YP_002502806.1) were aligned using ClustalW2 and the resulting alignment was viewed using Jalview 2.4.0.b2 (76). Dark blue shading indicates identical amino acid residues in all the species; whereas, light blue indicates identical residues among the specified species.
Figure 2.
Figure 2.
(A) SDS–PAGE analysis showing induced expression of M. tuberculosis H-NS and at various stages during its purification. Ten micrograms of proteins from the indicated sample was resolved on SDS–PAGE and visualized by staining with Coomassie blue. Lanes: 1, SDS–PAGE standards molecular mass markers; 2, uninduced cell-free lysate; 3, induced cell-free lysate; 4, (NH4)2SO4 precipitate; 5, chromatography on dsDNA cellulose; 6, chromatopraphy on Superdex S-75. (B) Side-by-side comparison of M. tuberculosis and E. coli H-NS proteins by SDS–PAGE. Lanes: 1, SDS–PAGE standards molecular mass markers; 2, E. coli H-NS (1 µg); 3, M. tuberculosis H-NS (1 µg). (C) Glutaraldehyde crosslinking of M. tuberculosis H-NS. The reactions were performed as described under ‘Experimental Procedures’ section. Lane 1, molecular weight standards; 2, H-NS incubated in the absence of glutaraldehyde; 3-6, H-NS incubated with concentrations of glutaraldehyde as indicated at the top of the gel image.
Figure 3.
Figure 3.
Mycobaterium tuberculosis H-NS binds poorly to double-stranded DNA containing high GC base pairs. Reactions were performed with 5 nM of the indicated 32P-labeled DNA substrate in the absence (lane1) or presence of 10, 25, 50,100, 150, 200, 250, 300 or 500 nM H-NS (lanes 2–0), respectively. A single or two parallel lines on the top of each panel of the Figure denote single- or double-stranded DNA, respectively. The open triangle on the top of the gel image denotes increasing concentrations of H-NS. Reaction products were separated as described under ‘Experimental Procedures’ section. (A) ssDNA; (B) dsDNA (40% GC); (C) dsDNA (70% GC). The positions of free DNA and protein–DNA complexes are shown in the left-hand side of each panel. (D) Graphical representation of binding of H-NS to different DNA substrates. The extent of formation of H-NS–DNA complexes in (A–C) is plotted versus varying concentrations of H-NS. Error bars indicate SEM.
Figure 4.
Figure 4.
Mycobacterium tuberculosis H-NS binds to the Holliday junction with high affinity. Reaction mixtures contained 5 nM of 32P-labeled HJ (A), 32P-labeled DNA replication fork (B) or 32P-labeled Y-shaped junction (C) in the absence (lane1) or presence of 10, 25, 50,100, 150, 200, 250, 300 or 500 nM H-NS (lanes 2–10), respectively. The open triangle on the top of the gel denotes increasing concentrations of H-NS. Reaction products were separated as described under ‘Experimental Procedures’ section. The positions of free DNA and protein–DNA complexes are shown in the left-hand side of each panel. (D) Graphical representation of the extent of binding of H-NS to different DNA substrates in (A–C) is plotted versus varying concentrations of H-NS.
Figure 5.
Figure 5.
Effect of NaCl on the stability of H-NS–DNA complexes. Reaction mixtures contained 5 nM of indicated 32P-labeled DNA substrate and 500 nM of M. tuberculosis H-NS. After incubation for 30 min, NaCl was added to the final concentration of 50 100, 200, 300, 400, 500, 750, 1000 or 1500 mM (lanes 3–11), respectively. After 10 min with NaCl, samples were electrophoresed on polyacrylamide gel, and this was followed by autoradiography as described under ‘Experimental Procedures’ section. (A) ssDNA; (B) dsDNA (40% GC); (C) HJ; (D) DNA replication fork; (E) Y-shaped junction; (F) the extent of dissociation of H-NS–DNA complex containing the indicated recombination intermediate is plotted versus varying concentrations of NaCl. Error bars indicate SEM.
Figure 6.
Figure 6.
Binding of E. coli H-NS to the HJ and to other DNA substrates. Reactions were performed with 1 nM of 32P-labeled DNA (duplex DNA having 40% GC content or replication fork) in the absence (lane 1) or presence of 0.1, 0.15, 0.25, 0.3, 0.5, 0.75, 1, 1.5, 2 and 3 µM E. coli H-NS (lanes 2–11), respectively. Similarly, 1 nM of 32P-labeled HJ was incubated in the absence (lane 1) or in the presence of 0.1, 0.15, 0.25, 0.3, 0.5, 0.75, 1, 1.5, 2, 2.5 and 3 µM E. coli H-NS (lanes 2–12), respectively. Reaction products were separated and visualized as described under ‘Experimental Procedures’ section. The open triangle on the top of the gel image denotes increasing concentrations of E. coli H-NS. (A) Linear duplex DNA; (B) HJ; (C) replication fork. The positions of free DNA and protein–DNA complexes are indicated on the left-hand side of the gel. (D) Graphical representation of E. coli H-NS binding to different DNA substrates. The extent of protein–DNA complexes in (A–C) is plotted versus varying protein concentrations. Standard deviations are derived from three independent experiments.
Figure 7.
Figure 7.
H-NS constrains DNA supercoils in vitro. Form-I DNA (1 μg) was incubated with the indicated amounts of purified H-NS protein and then treated with topoisomerase I. After deproteinization, DNA samples were electrophoresed on 0.8% agarose gel to resolve the topoisomers. Lane 1, the positions of form I and form IV (relaxed) DNA and positively supercoiled [(+) SC DNA] are shown in the left-hand side. Lane: 2, DNA incubated with topoisomerase I in the absence of H-NS; 3–8, contained topoisomerase I and indicated amounts of H-NS.
Figure 8.
Figure 8.
H-NS proteins suppress DNA strand exchange promoted by RecA protein. Assay was performed as described under ‘Experimental Procedures’ section. (A) Schematic depicting the experimental design. (B) Effect of M. tuberculosis H-NS on strand exchange by its cognate RecA. (C) Effect of E. coli H-NS on strand exchange by its cognate RecA. The positions of 32P-labeled displaced ssDNA, 32P-labeled duplex DNA or unlabeled heteroduplex DNA (hDNA) generated by RecA promoted strand transfer are shown in the left-hand side of the gel images. The open triangle on top of the gel images denotes increasing concentrations of H-NS. Lane1, control reactions lacking H-NS and RecA; lane 2, complete reaction in the absence of H-NS; lanes 3–10, complete reaction in the presence of 0.5, 1, 1.5, 2, 2.5, 3, 3.5 and 4 μM H-NS, respectively. An asterisk represents the labeled phosphate at the 5′ end.

Similar articles

Cited by

References

    1. Travers A, Muskhelishvili G. Bacterial chromatin. Curr. Opin. Genet. Dev. 2005;15:507–514. - PubMed
    1. Rouviere-Yaniv J, Gros F. Characterization of a novel, low-molecular-weight DNA-binding protein from Escherichia coli. Proc. Natl Acad. Sci. USA. 1975;72:3428–3432. - PMC - PubMed
    1. Drlica K, Rouviere-Yaniv J. Histone-like proteins of bacteria. Microbiol. Rev. 1987;51:301–319. - PMC - PubMed
    1. Dame RT. The role of nucleoid-associated proteins in the organization and compaction of bacterial chromatin. Mol. Microbiol. 2005;56:858–870. - PubMed
    1. Luijsterburg MS, White MF, van Driel R, Dame RT. The major architects of chromatin: architectural proteins in bacteria, archaea and eukaryotes. Crit. Rev. Biochem. Mol. Biol. 2008;43:393–418. - PubMed

Publication types

MeSH terms