. 2010 Jun;38(10):e117.
doi: 10.1093/nar/gkq110. Epub 2010 Feb 21.

Teolenn: an efficient and customizable workflow to design high-quality probes for microarray experiments

Affiliations

Teolenn: an efficient and customizable workflow to design high-quality probes for microarray experiments

Laurent Jourdren et al. Nucleic Acids Res. 2010 Jun.

Abstract

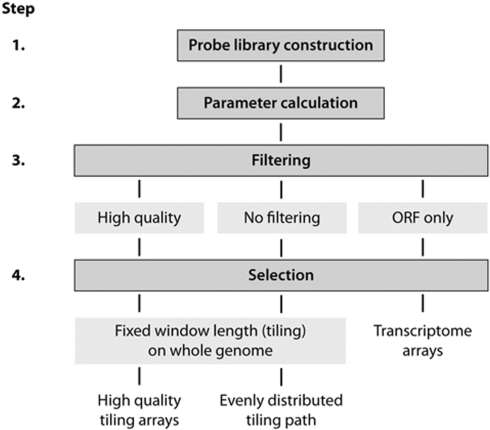
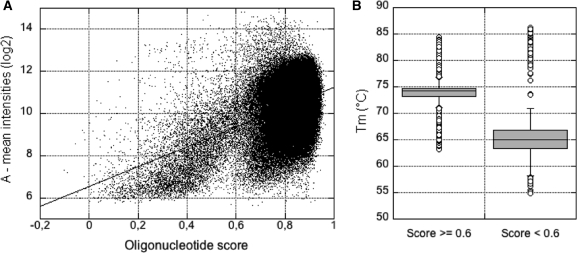
Despite the development of new high-throughput sequencing techniques, microarrays are still attractive tools to study small genome organisms, thanks to sample multiplexing and high-feature densities. However, the oligonucleotide design remains a delicate step for most users. A vast array of software is available to deal with this problem, but each program is developed with its own strategy, which makes the choice of the best solution difficult. Here we describe Teolenn, a universal probe design workflow developed with a flexible and customizable module organization allowing fixed or variable length oligonucleotide generation. In addition, our software is able to supply quality scores for each of the designed probes. In order to assess the relevance of these scores, we performed a real hybridization using a tiling array designed against the Trichoderma reesei fungus genome. We show that our scoring pipeline correlates with signal quality for 97.2% of all the designed probes, allowing for a posteriori comparisons between quality scores and signal intensities. This result is useful in discarding any bad scoring probes during the design step in order to get high-quality microarrays. Teolenn is available at http://transcriptome.ens.fr/teolenn/.


Figures

Figure 1.
Figure 1.
Probe design workflow. The probe design workflow is composed of four steps (see text for details). Here we show several application possibilities depending on the parameters used for the filtering and selection steps. For example, to design a classical transcriptome microarray, the filtering step will keep only the probes from the library that are found in ORFs from genome annotations. Next, the selection step will select the best probes (or several) for each ORF according to user’s specifications. At the opposite, one can make a design without any a priori on genome annotation for tiling arrays. On this figure, we show two different ways to design tiling arrays. The first one creates ‘high-quality’ tiling arrays by filtering low quality probes from the library out (e.g. high or low GC content, non-homogenous melting temperature, etc.). In each window with a fixed length, the best probe will be selected only among the highest quality oligonucleotides of the library. With such a design it is possible that several windows do not get to any corresponding probe. At the opposite, if one wants to favour an even distribution of the tiling path, the constraint on probe filtering can be relaxed in order to keep most of the probes from the library. All the windows will then have a probe selected, though with lower quality parameters.
Figure 2.
Figure 2.
Library probes parameter distribution. Distribution of two parameters calculated for each probe of the oligonucleotide library. (A) Distribution of GC content for all possible probes from the library. The GC percent range is from 0 to 1 on the x-axis and the total number of probes in each category is shown on the y-axis. (B) Distribution of the melting temperature for all possible probes from the library. The Tm range in °C is displayed from 0 to 100 on the x-axis and the total number of probes in each category is shown on the y-axis.
Figure 3.
Figure 3.
Comparison of the sensitivity of probe sets designed with OligoTiler, ArrayDesign and Teolenn software. For each probe set designed, boxplots show the distribution of (A) the GC percent, (B) the melting temperature (Tm) in °C and (C) the secondary structure free energy in kcal/mol.
Figure 4.
Figure 4.
Comparison of the specificity of probe sets designed with OligoTiler, ArrayDesign and Teolenn software. (A) Distribution of the distance in base pairs between two consecutive oligonucleotides. (B) Distribution of the number of BLAST hits by oligonucleotide using the first Kane parameter (see ‘Materials and Methods’ section for details). (C) Distribution of the number of designed probes per annotated transcript in the reference genome.
Figure 5.
Figure 5.
Correlation between oligonucleotide scores and spot intensities. (A) The graph displays for each probe the average of log2 intensities (A value) for the corresponding spot as a function of the oligonucleotide score calculated with Teolenn software. The straight line is the linear correlation between the two axes. (B) Distribution of Tm values for two sets of probes with intensities >10 (see A). Boxplots display the melting temperatures (Tm values) of high-quality scores (≥0.6, left) and low quality ones (<0.6, right).

Similar articles

Cited by

References

    1. Wold B, Myers RM. Sequence census methods for functional genomics. Nat. Meth. 2008;5:19–21. - PubMed
    1. Shendure J. The beginning of the end for microarrays? Nat. Meth. 2008;5:585–587. - PubMed
    1. Lemoine S, Combes F, Le Crom S. An evaluation of custom microarray applications: the oligonucleotide design challenge. Nucleic Acids Res. 2009;37:1726–1739. - PMC - PubMed
    1. Bertone P, Trifonov V, Rozowsky JS, Schubert F, Emanuelsson O, Karro J, Kao MY, Snyder M, Gerstein M. Design optimization methods for genomic DNA tiling arrays. Genome Res. 2006;16:271–281. - PMC - PubMed
    1. Lipson D, Yakhini Z, Aumann Y. Optimization of probe coverage for high-resolution oligonucleotide aCGH. Bioinformatics. 2007;23:e77–e83. - PubMed

Publication types

MeSH terms

Substances