

Variations in the response of pituitary lactotrophs to oxytocin during the rat estrous cycle
- PMID: 20176719
- PMCID: PMC2850224
- DOI: 10.1210/en.2009-1267
Variations in the response of pituitary lactotrophs to oxytocin during the rat estrous cycle
Abstract
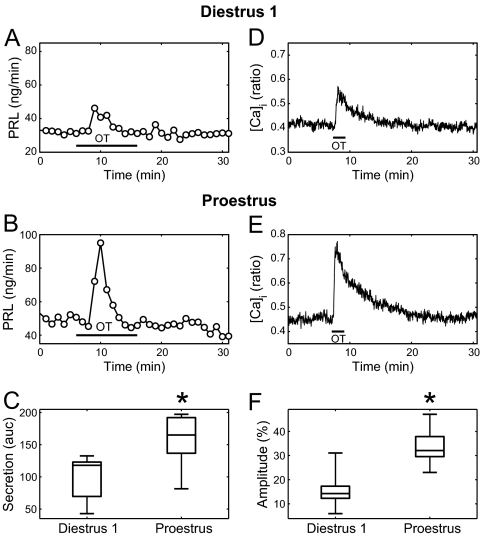
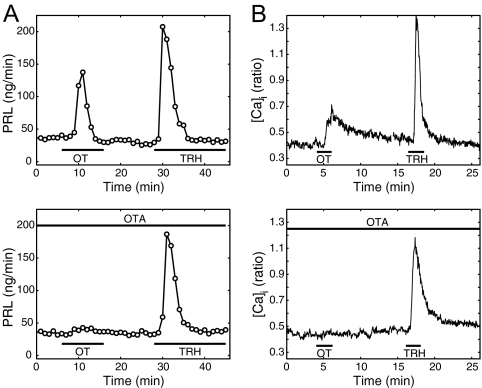
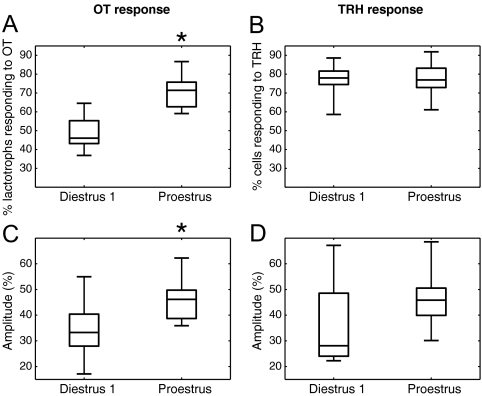
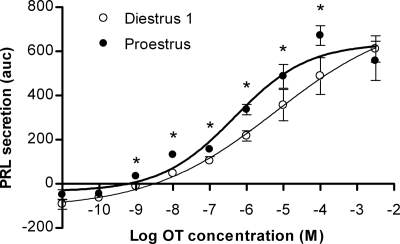
Although removal of dopamine inhibition is established as a major factor in prolactin (PRL) release, a large body of evidence suggests that hypothalamic oxytocin (OT) may serve as a PRL-releasing hormone in the rat. PRL release is modulated by estradiol (E2), which rises between diestrus and proestrus of the estrous cycle, causing a PRL surge in the afternoon of proestrus. Given that E2 strongly modulates OT actions in both central and peripheral tissues, OT action on lactotrophs might also be modulated by the stage of the estrous cycle. To test this hypothesis, we have monitored PRL release and intracellular calcium levels ([Ca(2+)](i)) induced by OT in pituitary lactotrophs obtained from female rats in either diestrus 1 or proestrus. We found that both secretory and [Ca(2+)](i) responses to OT are significantly increased in lactotrophs obtained on proestrus. Moreover, we show that these differences are due to an increase in both the number of OT-responding lactotrophs and the magnitude of their individual [Ca(2+)](i) responses. Both secretory and [Ca(2+)](i) responses were abolished by a specific OT antagonist. Finally, dose-dependent studies show that the increased PRL-releasing effect of OT on proestrus is significant over a wide range of concentrations, particularly those observed in hypophyseal portal plasma. These results suggest that the rising E2 titers that culminate on proestrus facilitate the stimulatory action of OT on lactotrophs and support the notion that OT is a PRL-releasing hormone with an important role in the production of the proestrous surge of PRL.
Figures
Similar articles
-
A tale of two rhythms: the emerging roles of oxytocin in rhythmic prolactin release.J Neuroendocrinol. 2010 Jul;22(7):778-84. doi: 10.1111/j.1365-2826.2010.02012.x. Epub 2010 Apr 29. J Neuroendocrinol. 2010. PMID: 20456600 Free PMC article. Review.
-
Functional expression of the dopamine-activated K(+) current in lactotrophs during the estrous cycle in female rats: correlation with prolactin secretory responses.Endocrine. 2003 Feb-Mar;20(1-2):67-74. doi: 10.1385/ENDO:20:1-2:67. Endocrine. 2003. PMID: 12668870
-
Estrogen regulation of the dopamine-activated GIRK channel in pituitary lactotrophs: implications for regulation of prolactin release during the estrous cycle.Am J Physiol Regul Integr Comp Physiol. 2011 Sep;301(3):R746-56. doi: 10.1152/ajpregu.00138.2011. Epub 2011 Jun 8. Am J Physiol Regul Integr Comp Physiol. 2011. PMID: 21653876 Free PMC article.
-
Role of Oxytocin in Prolactin Secretion during Late Pregnancy.Neuroendocrinology. 2018;106(4):324-334. doi: 10.1159/000480669. Epub 2017 Aug 27. Neuroendocrinology. 2018. PMID: 28848175
-
Multiple roles of Gi/o protein-coupled receptors in control of action potential secretion coupling in pituitary lactotrophs.Ann N Y Acad Sci. 2009 Jan;1152:174-86. doi: 10.1111/j.1749-6632.2008.03994.x. Ann N Y Acad Sci. 2009. PMID: 19161388 Free PMC article. Review.
Cited by
-
Oxytocin receptor induces mammary tumorigenesis through prolactin/p-STAT5 pathway.Cell Death Dis. 2021 Jun 7;12(6):588. doi: 10.1038/s41419-021-03849-8. Cell Death Dis. 2021. PMID: 34099636 Free PMC article.
-
Fast-activating voltage- and calcium-dependent potassium (BK) conductance promotes bursting in pituitary cells: a dynamic clamp study.J Neurosci. 2011 Nov 16;31(46):16855-63. doi: 10.1523/JNEUROSCI.3235-11.2011. J Neurosci. 2011. PMID: 22090511 Free PMC article.
-
A tale of two rhythms: the emerging roles of oxytocin in rhythmic prolactin release.J Neuroendocrinol. 2010 Jul;22(7):778-84. doi: 10.1111/j.1365-2826.2010.02012.x. Epub 2010 Apr 29. J Neuroendocrinol. 2010. PMID: 20456600 Free PMC article. Review.
-
Ion channels and signaling in the pituitary gland.Endocr Rev. 2010 Dec;31(6):845-915. doi: 10.1210/er.2010-0005. Epub 2010 Jul 21. Endocr Rev. 2010. PMID: 20650859 Free PMC article. Review.
-
Systemic oxytocin induces a prolactin secretory rhythm via the pelvic nerve in ovariectomized rats.Am J Physiol Regul Integr Comp Physiol. 2011 Sep;301(3):R676-81. doi: 10.1152/ajpregu.00176.2011. Epub 2011 Jun 15. Am J Physiol Regul Integr Comp Physiol. 2011. PMID: 21677274 Free PMC article.
References
-
- Ben-Jonathan N, Oliver C, Weiner HJ, Mical RS, Porter JC 1977 Dopamine in hypophysial portal plasma of the rat during the estrous cycle and throughout pregnancy. Endocrinology 100:452–458 - PubMed
-
- Ben-Jonathan N, Arbogast LA, Hyde JF 1989 Neuroendocrine Regulation of prolactin-release. Prog Neurobiol 33:399–447 - PubMed
-
- Martinez de la Escalera G, Weiner RI 1992 Dissociation of dopamine from its receptor as a signal in the pleiotropic hypothalamic regulation of prolactin secretion. Endocr Rev 13:241–255 - PubMed
-
- DeMaria JE, Livingstone JD, Freeman ME 1998 Characterization of the dopaminergic input to the pituitary gland throughout the estrous cycle of the rat. Neuroendocrinology 67:377–383 - PubMed
-
- McCann SM, Lumpkin MD, Mizunuma H, Khorram O, Ottlecz A, Samson WK 1984 Peptidergic and dopaminergic control of prolactin release. Trends Neurosci 7:127–131
Publication types
MeSH terms
Substances
Grants and funding
LinkOut - more resources
Full Text Sources
Miscellaneous
