

The effect of insulin signaling on female reproductive function independent of adiposity and hyperglycemia
- PMID: 20176725
- PMCID: PMC2851187
- DOI: 10.1210/en.2009-0788
The effect of insulin signaling on female reproductive function independent of adiposity and hyperglycemia
Abstract
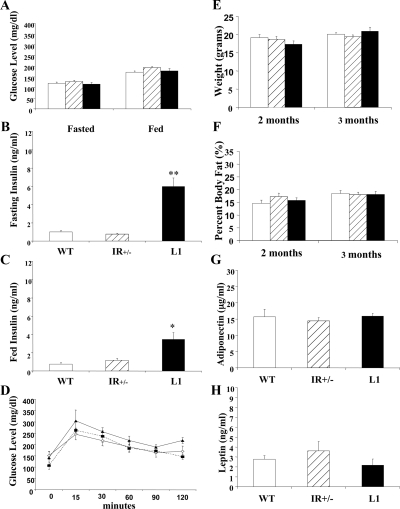
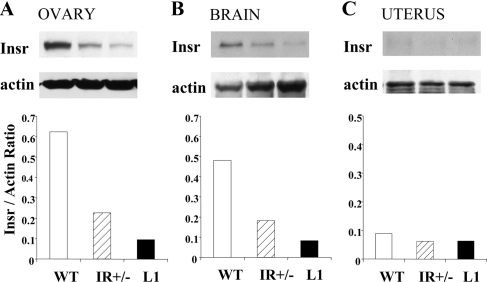
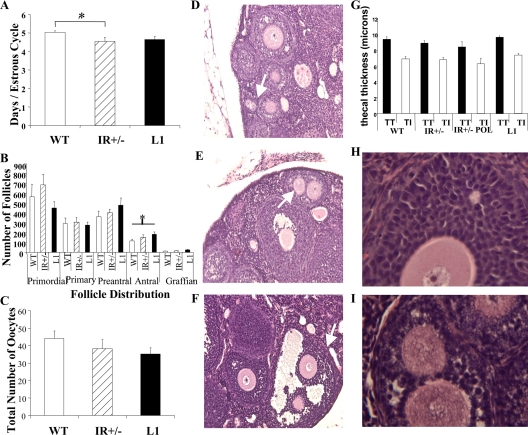
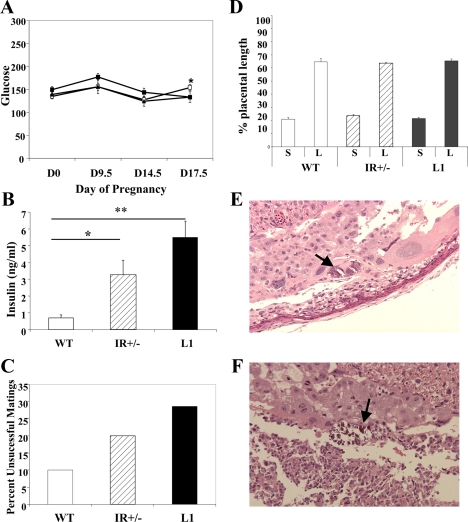
Physiological states of insulin resistance such as obesity and diabetes have been linked to abnormalities in female reproductive function. However, it is difficult to distinguish the direct effects of impaired insulin signaling from those of adiposity or hyperglycemia because these conditions often coexist in human syndromes and animal models of insulin resistance. In this study, we used lean, normoglycemic mouse lines with differing degrees of hyperinsulinemia and insulin receptor (Insr) expression to dissect the effects of altered insulin signaling on female reproduction. All three mouse lines [Ttr-Insr(-/-), Insr(+/-), and Insr(+/+) (wild type)] are able to maintain fertility. However, the insulin-resistant and hyperinsulinemic mice demonstrate altered duration of estrous cycles as well as aberrant distribution and morphology of ovarian follicles. These effects appear to be independent of hyperandrogenism in the mice. Pregnancy studies indicate decreased success in early progression of gestation. In successful pregnancies, decreased embryo weights and increased placental calcification also implicate altered insulin signaling in later gestational effects. Thus, abnormal insulin signaling, independent of adipose tissue mass, adipokine expression levels, and hyperglycemia, can affect parameters of the female hypothalamic-pituitary-gonadal axis and pregnancy outcomes.
Figures
Similar articles
-
Rescue of obesity-induced infertility in female mice due to a pituitary-specific knockout of the insulin receptor.Cell Metab. 2010 Sep 8;12(3):295-305. doi: 10.1016/j.cmet.2010.06.010. Cell Metab. 2010. PMID: 20816095 Free PMC article.
-
Effects of hyperandrogenemia and increased adiposity on reproductive and metabolic parameters in young adult female monkeys.Am J Physiol Endocrinol Metab. 2014 Jun 1;306(11):E1292-304. doi: 10.1152/ajpendo.00310.2013. Epub 2014 Apr 15. Am J Physiol Endocrinol Metab. 2014. PMID: 24735887 Free PMC article.
-
Environmental obesogen tributyltin chloride leads to abnormal hypothalamic-pituitary-gonadal axis function by disruption in kisspeptin/leptin signaling in female rats.Toxicol Appl Pharmacol. 2017 Mar 15;319:22-38. doi: 10.1016/j.taap.2017.01.021. Epub 2017 Feb 2. Toxicol Appl Pharmacol. 2017. PMID: 28161095
-
Effects of growth hormone overexpression and growth hormone resistance on neuroendocrine and reproductive functions in transgenic and knock-out mice.Proc Soc Exp Biol Med. 1999 Nov;222(2):113-23. doi: 10.1046/j.1525-1373.1999.d01-121.x. Proc Soc Exp Biol Med. 1999. PMID: 10564535 Review.
-
Altered maternal metabolism during mild gestational hyperglycemia as a predictor of adverse perinatal outcomes: A comprehensive analysis.Biochim Biophys Acta Mol Basis Dis. 2020 Feb 1;1866(2):165478. doi: 10.1016/j.bbadis.2019.05.014. Epub 2019 May 30. Biochim Biophys Acta Mol Basis Dis. 2020. PMID: 31152867 Review.
Cited by
-
TNFAIP3 Reduction-of-Function Drives Female Infertility and CNS Inflammation.Front Immunol. 2022 Apr 8;13:811525. doi: 10.3389/fimmu.2022.811525. eCollection 2022. Front Immunol. 2022. PMID: 35464428 Free PMC article.
-
Insulin and insulin-like growth factor signaling increases proliferation and hyperplasia of the ovarian surface epithelium and decreases follicular integrity through upregulation of the PI3-kinase pathway.J Ovarian Res. 2013 Feb 7;6(1):12. doi: 10.1186/1757-2215-6-12. J Ovarian Res. 2013. PMID: 23388061 Free PMC article.
-
Neuroanatomical Framework of the Metabolic Control of Reproduction.Physiol Rev. 2018 Oct 1;98(4):2349-2380. doi: 10.1152/physrev.00033.2017. Physiol Rev. 2018. PMID: 30109817 Free PMC article. Review.
-
Minireview: Metabolic control of the reproductive physiology: insights from genetic mouse models.Horm Behav. 2014 Jun;66(1):7-14. doi: 10.1016/j.yhbeh.2014.04.007. Epub 2014 Apr 16. Horm Behav. 2014. PMID: 24746731 Free PMC article. Review.
-
Insulin resistance and the polycystic ovary syndrome revisited: an update on mechanisms and implications.Endocr Rev. 2012 Dec;33(6):981-1030. doi: 10.1210/er.2011-1034. Epub 2012 Oct 12. Endocr Rev. 2012. PMID: 23065822 Free PMC article. Review.
References
-
- Dunaif A 1997 Insulin resistance and the polycystic ovary syndrome: mechanism and implications for pathogenesis. Endocr Rev 18:774–800 - PubMed
-
- Legro RS 2001 Polycystic ovary syndrome: the new millennium. Mol Cell Endocrinol 184:87–93 - PubMed
-
- Diamanti-Kandarakis E, Kandarakis HA 2003 Conservative management of gynecological diseases: insulin sensitizing agents in polycystic ovary syndrome. Ann NY Acad Sci 997:322–329 - PubMed
-
- Vega GL, Adams-Huet B, Peshock R, Willett D, Shah B, Grundy SM 2006 Influence of body fat content and distribution on variation in metabolic risk. J Clin Endocrinol Metab 91:4459–4466 - PubMed
-
- Kjaer K, Hagen C, Sandø SH, Eshøj O 1992 Epidemiology of menarche and menstrual disturbances in an unselected group of women with insulin-dependent diabetes mellitus compared to controls. J Clin Endocrinol Metab 75:524–529 - PubMed
Publication types
MeSH terms
Substances
Grants and funding
LinkOut - more resources
Full Text Sources
Medical
Molecular Biology Databases
Research Materials
Miscellaneous
