. 2010 Mar 15;207(3):505-20.
doi: 10.1084/jem.20090397. Epub 2010 Feb 22.

Lymphoma endothelium preferentially expresses Tim-3 and facilitates the progression of lymphoma by mediating immune evasion

Affiliations

Lymphoma endothelium preferentially expresses Tim-3 and facilitates the progression of lymphoma by mediating immune evasion

Xiaoyuan Huang et al. J Exp Med. .

Erratum in

Abstract

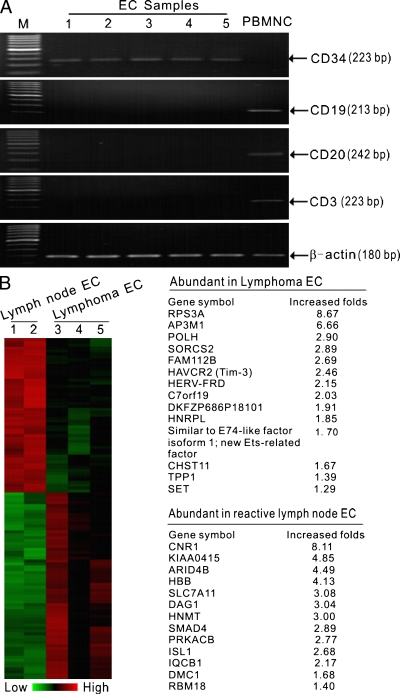
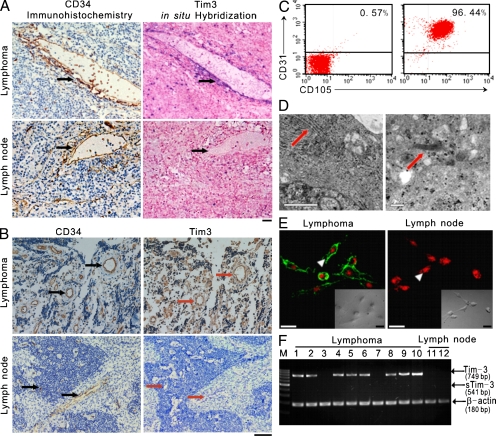
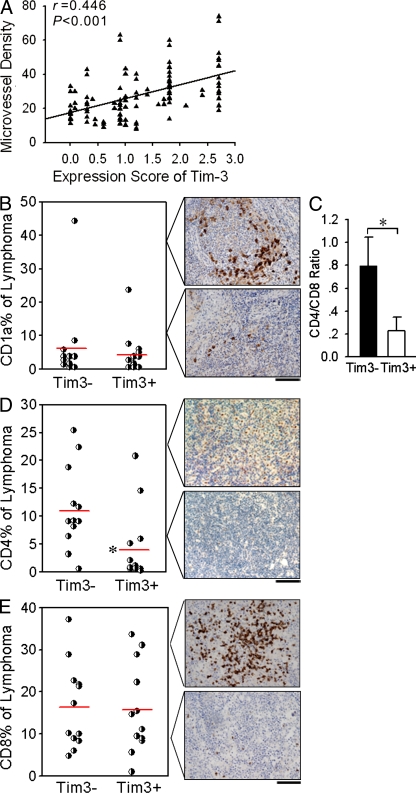
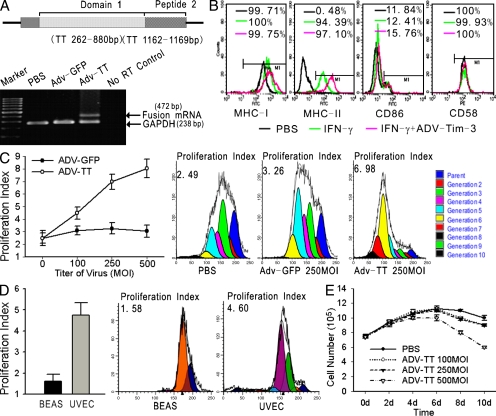
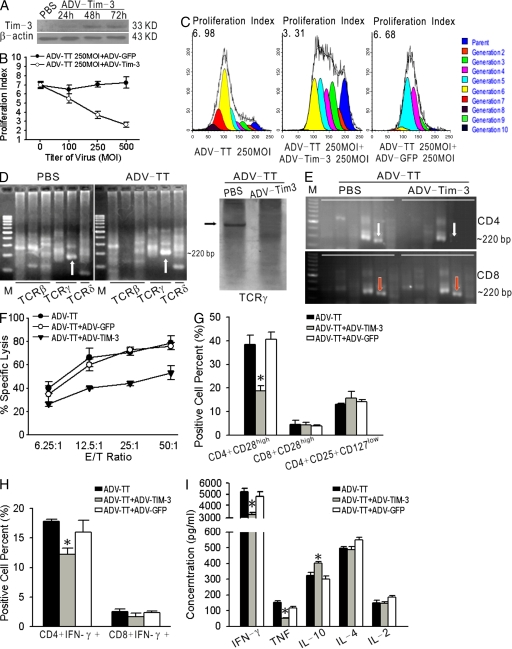
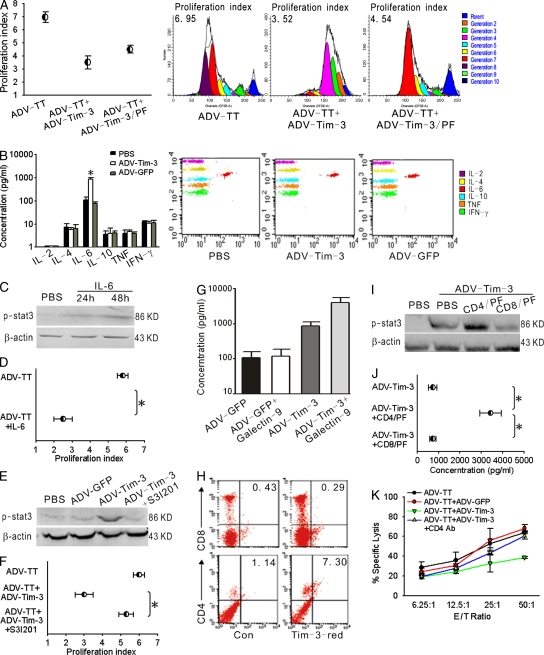
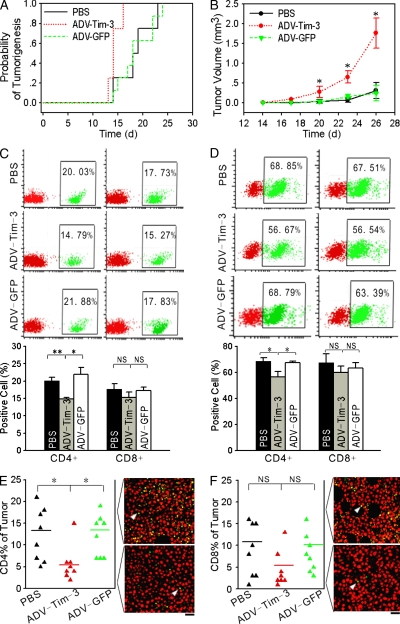
Angiogenesis is increasingly recognized as an important prognosticator associated with the progression of lymphoma and as an attractive target for novel modalities. We report a previously unrecognized mechanism by which lymphoma endothelium facilitates the growth and dissemination of lymphoma by interacting with circulated T cells and suppresses the activation of CD4(+) T cells. Global gene expression profiles of microdissected endothelium from lymphoma and reactive lymph nodes revealed that T cell immunoglobulin and mucin domain-containing molecule 3 (Tim-3) was preferentially expressed in lymphoma-derived endothelial cells (ECs). Clinically, the level of Tim-3 in B cell lymphoma endothelium was closely correlated to both dissemination and poor prognosis. In vitro, Tim-3(+) ECs modulated T cell response to lymphoma surrogate antigens by suppressing activation of CD4(+) T lymphocytes through the activation of the interleukin-6-STAT3 pathway, inhibiting Th1 polarization, and providing protective immunity. In a lymphoma mouse model, Tim-3-expressing ECs promoted the onset, growth, and dissemination of lymphoma by inhibiting activation of CD4(+) T cells and Th1 polarization. Our findings strongly argue that the lymphoma endothelium is not only a vessel system but also a functional barrier facilitating the establishment of lymphoma immune tolerance. These findings highlight a novel molecular mechanism that is a potential target for enhancing the efficacy of tumor immunotherapy and controlling metastatic diseases.


Figures

Figure 1.
Figure 1.
Transcriptional profiles of lymphoma endothelium. (A) Evaluation of purity of LCM-isolated ECs before GeneChip probe arrays. Five samples were used for subsequent GeneChip probe arrays. In these samples, the endothelial marker CD34 showed robust amplification only in the endothelium fraction. However, the contamination of nonendothelium tissues was excluded because no T or B lymphocyte markers were detected. (B) Comparison of the global gene expression profiles associated with lymphomas versus reactive lymph node vessels. (left) Heat maps were developed with the GeneSpring hierarchical clustering algorithm after eliminating all genes for which the difference in the means was less than the SE of the difference of means between groups. (right) List of genes and expressed sequence tags overexpressed in LCM-isolated endothelium from lymphoma or reactive lymph node samples.
Figure 2.
Figure 2.
Tim-3 is preferentially expressed on lymphoma-derived ECs. (A) In situ hybridization of cryosections of lymph nodes of lymphoma or reactive lymph nodes. (left) CD34-positive microvessels in lymphomas or reactive lymph nodes (brown; arrows). (right) Tim-3 transcripts (blue) were detected in microvessels (arrows) in lymphomas but not in reactive lymph nodes. Bar, 20 µm. (B) Immunohistochemical staining of CD34 (left) and Tim-3 (right) proteins. Immunoreactive Tim-3 (red arrows) was readily detectable in the endothelium (black arrows) of lymphoma but not in reactive lymph node endothelium. Bar, 20 µm. (C) ECs purified from lymph nodes of lymphoma or reactive lymph nodes. Isolated ECs were costained with antibodies against CD31 and CD105. Cells were analyzed by flow cytometry. (right) The isolated ECs were found to be >95% pure. (left) Antibody isotype control. Similar results were observed in three independent experiments. (D) Isolated ECs viewed by transmission electron microscopy. The ECs contained plentiful endoplasmic reticulum in the cytoplasm (left, arrow), and Weible-Palade bodies were observed (right, arrow). Bars: (left) 1 µm; (right) 0.2 µm. (E) ECs purified from lymphomas (left) and reactive lymph nodes (right) stained with an immunofluorescent anti–Tim-3 antibody and observed with a confocal laser scanning microscope. Tim-3 protein (green; arrowhead) is in the cell membranes of lymphoma ECs. Cell nuclei (red; arrowhead) were visualized by staining with propidium iodide. Bars, 100 µm. (F) RT-PCR of Tim-3 mRNA and sTim-3 mRNA from 10 lymphoma samples and 2 reactive lymph node samples.
Figure 3.
Figure 3.
Tim-3–expressing endothelium in lymphomas correlates with local immune profiles. (A) Scatter plot showing Tim-3 expression versus MVD in 105 lymphoma samples. MVD in lymphoma sections significantly correlated with levels of Tim-3 protein in the endothelium, as defined by immunoreactivity scores (r = 0.446; P < 0.001). (B) Mean (red lines) of CD1a+ dendritic cells. (top right) A typical image represents higher CD1a+ expression than the mean percentage. (bottom right) A typical image represents lower CD1a+ expression than the mean percentage. (C) CD4+/CD8+ cell ratio for Tim-3–negative (n = 12) and Tim-3–positive (n = 12) DLBCLs. Data are presented as means ± SD of at least three experiments. (D) CD4+ T cell and (E) CD8+ T cell populations are presented as a percentage of total lymph node cells. Representative images of the lymphocyte population (brown; stained with antibody against CD1a+, CD4+, or CD8+) appear to the right of each graph. Bars, 50 µm. *, P < 0.01.
Figure 4.
Figure 4.
Validation of an in vitro cell model for studying interactions between ECs and autologous T lymphocytes. (A, top) Schematic of the ADV-TT construct. (bottom) Transcripts of TT in ADV-TT–infected UVECs were detected by RT-PCR. ADV-GFP and PBS were included as negative controls. (B) Expression of MHC class I, MHC class II, CD86, or CD58 in freshly isolated UVECs treated with PBS (black), IFN-γ (green), or IFN-γ + ADV–Tim-3 (red). (C) UVECs were infected with ADV-TT or ADV-GFP and incubated with CFSE-labeled autologous lymphocytes. The proliferation of lymphocytes was measured by FACS. (right) CFSE profiles of lymphocytes treated with ADV-GFP or ADV-TT. Data are represented as means ± SD of triplicates. (D) BEAS and UVECs were infected with ADV-TT at an MOI of 250 and incubated with CFSE-labeled autologous lymphocytes. The proliferation of lymphocytes was measured by FACS. (right) CFSE profiles of lymphocytes treated with ADV-TT. Data are represented as means ± SD of triplicates. (E) Cell proliferation of UVECs infected with various titers of ADV-TT. Infection of ADV-TT did not lead to an increase in UVEC cell numbers compared with infection with ADV-GFP or at any of the MOIs examined. Data are represented as means ± SD of triplicates. Similar results were observed in four (B) or three (C–E) independent experiments.
Figure 5.
Figure 5.
Expression of Tim-3 in UVECs abolished the activation of CD4+ T cells and provided protective immunity. (A) Expression of Tim-3 was determined by Western blotting in UVECs infected with ADV–Tim-3 or treated with PBS. (B) UVECs infected with various adenoviral mutants were incubated with CFSE-labeled lymphocytes and subjected to proliferation analysis. ADV–Tim-3 but not ADV-GFP inhibited the proliferation of lymphocytes. Data are represented as means ± SD of triplicates. (C) Typical CFSE profiles of lymphocytes with different treatments. (D) Biomed-2 multiplex TCR PCR to analyze the T cell repertoire after various treatments. UVECs infected with ADV-TT were incubated with lymphocytes. Multiplex PCR was used to amplify six TCR subfamily genes from activated lymphocytes. (left) A positive clonal TCRγ rearrangement against ADV-TT (arrows). (right) The positive clonal TCRγ rearrangement against ADV-TT (arrow) was inhibited by ADV–Tim-3. (E) Biomed-2 multiplex TCR PCR to analyze the T cell repertoire after various treatments. UVECs infected with ADV-TT were incubated with isolated CD4+ or CD8+ T cells. Multiplex PCR was used to amplify six TCR subfamily genes from activated lymphocytes. The positive clonal TCRγ rearrangement against ADV-TT was inhibited by ADV–Tim-3 in CD4+ T cells (white arrows) but not in CD8+ T cells (red arrows). (F) Lymphocytes were incubated with ADV-TT–infected dendritic cells. The resulting CTLs were added to ADV-TT–infected UVECs in the presence or absence of ADV–Tim-3. The culture supernatant was then determined by an LDH release assay for specific lysis. Data are represented as means ± SD of triplicates. (G) UVECs were infected with varied viral mutants and incubated with autologous lymphocytes. Lymphocytes were analyzed for T cell subpopulations. Data are represented as means ± SD of triplicates. (H) Lymphocytes were treated as described in G and analyzed for CD4+/IFN-γ+ and CD8+/IFN-γ+ populations. Data are represented as means ± SD of triplicates. (I) UVEC/T cell culture supernatants were measured for production of the Th1/Th2 cytokines IFN-γ, TNF, IL-10, IL-4, and IL-2. Data are represented as means ± SD of triplicates. Similar results were observed in three (A, B, and F–I) or four (D and E) independent experiments. *, P < 0.01.
Figure 6.
Figure 6.
Mechanisms underlying the negative impact of Tim-3–expressing ECs on the activation of lymphocytes. (A) UVECs infected with ADV-TT and ADV–Tim-3 were fixed with 2% paraformaldehyde, incubated with CFSE-labeled lymphocytes, and subjected to proliferation analysis. (left) Although ADV-TT–stimulated lymphocyte proliferation was suppressed by Tim-3–expressing ECs, the suppression was partially reversed if Tim-3–expressing ECs were fixed by paraformaldehyde. (right) Typical CFSE profiles of lymphocytes in response to different treatments. PF, UVECs fixed with 2% paraformaldehyde. (B) The supernatants of UVECs infected with various adenoviral mutants were determined for production of the Th1/Th2 cytokines IL-2 (purple), IL-4 (yellow), IL-6 (red), IL-10 (blue), TNF (orange), and IFN-γ (green). Data are represented as means ± SD of triplicates. (right) Typical results of CBA analysis determined by flow cytometry. (C) UVECs were treated with 50 ng/ml IL-6 or PBS (negative control) for 48 h and analyzed for levels of p-STAT3. (D) UVECs were treated as described in C and subjected to lymphocyte proliferation analysis. (E) UVECs were treated as depicted and examined for levels of p-STAT3 protein. S3I201, UVECs treated with 50 µM S3I201 for 48 h. (F) UVECs were treated as described in E, and lymphocyte proliferation index were determined. (G) 300 µl of supernatants containing recombinant galectin-9 was mixed with 200 µl of culture medium, added into UVECs infected with ADV-GFP or ADV–Tim-3, and cultured for 48 h before IL-6 assays. Supernatants from empty vector-transfected CHO cells were used as a control. (H) 200 µl of CHO cell supernatants (from cells transfected with pTim-3–RED [right] or pDsRed-Express-1 [left]) was added to 5 × 10⁵ autologous T lymphocytes. After incubation for 3 h, the cells were subjected to flow cytometry analysis for the percentage of RED-positive cells. Con, addition of supernatant of the CHO cells transfected with pDsRed-Express-1 (left). (I) Tim-3–expressing UVECs were incubated with paraformaldehyde-fixed CD4+ or CD8+ T cells and the levels of p-STAT3 were determined. (J) Tim-3–expressing UVECs were treated as described in I and the production of IL-6 was determined. (K) Lymphocytes were incubated with ADV-TT–infected dendritic cells. The resulting CTLs were added to ADV-TT–infected UVECs in the presence or absence of ADV–Tim-3. Anti-CD4 blocking antibody was added into the co-cultured system at a final concentration of 8 µg/ml. The culture supernatant was then examined by an LDH release assay for specific lysis. Data are represented as means ± SD of triplicates. Similar results were observed in four (A and C–F) or three (B and G–K) independent experiments. *, P < 0.05.
Figure 7.
Figure 7.
Tim-3–expressing ECs impair T cell antitumor immunity and facilitate tumor growth in vivo. TA2 mice were inoculated into the inguinal groove muscle with 5 × 10⁵ lymphoma cells. ECs were isolated and purified from the bone marrow of healthy TA2 mice and infected with ADV–Tim-3, ADV-GFP, or PBS. Each group included eight model mice. 5 × 10⁴ ECs were injected into the same site for tumor inoculation on days 3, 6, and 9 after tumor implantation. (A) Cumulative probability of tumor onset was determined by the appearance of neoplasms into the inguinal groove muscle. In PBS- or Adv-GFP–treated EC groups, lymphoma formation at the inoculation sites took an average of 18.5 ± 3.4 d or 18.8 ± 3.6 d, respectively, whereas ADV–Tim-3–infected ECs significantly shortened the formation time of lymphomas at primary sites to 14.3 ± 1.2 d (ADV–Tim-3 versus PBS group, P = 0.01; ADV–Tim-3 versus ADV-GFP group, P = 0.01). (B) Tumor volume was monitored. (C) Peripheral blood cells and (D) spleen cells from TA2 mice were stained with an FITC-conjugated mAb to mouse CD4 and CD8 and analyzed by flow cytometry. (top) Representative data of flow cytometry analysis. (bottom) Data in columns are representative of four experiments and represented as means ± SD. (E) CD4+ and (F) CD8+ T cell populations as percentages of total tumor cells are shown. Horizontal bars represent means. Representative immunofluorescence images of infiltrating lymphocyte populations (green; arrowheads) are shown against the background of tumor cells (red). Bars, 20 µm. *, P < 0.05; **, P < 0.01.

Similar articles

Cited by

References

    1. Bai X., Huang M., Wu J., Huang X., Yan L., Lu Y., Wang S., Xu G., Zhou J., Ma D. 2008. Development and characterization of a novel method to analyze global gene expression profiles in endothelial cells derived from primary tissues. Am. J. Hematol. 83:26–33 10.1002/ajh.20953 - DOI - PubMed
    1. Bruns I., Fox F., Reinecke P., Kobbe G., Kronenwett R., Jung G., Haas R. 2005. Complete remission in a patient with relapsed angioimmunoblastic T-cell lymphoma following treatment with bevacizumab. Leukemia. 19:1993–1995 10.1038/sj.leu.2403936 - DOI - PubMed
    1. Choi J., Enis D.R., Koh K.P., Shiao S.L., Pober J.S. 2004. T lymphocyte-endothelial cell interactions. Annu. Rev. Immunol. 22:683–709 10.1146/annurev.immunol.22.012703.104639 - DOI - PubMed
    1. Cooke B.M., Usami S., Perry I., Nash G.B. 1993. A simplified method for culture of endothelial cells and analysis of adhesion of blood cells under conditions of flow. Microvasc. Res. 45:33–45 10.1006/mvre.1993.1004 - DOI - PubMed
    1. Coupel S., Leboeuf F., Boulday G., Soulillou J.P., Charreau B. 2004. RhoA activation mediates phosphatidylinositol 3-kinase-dependent proliferation of human vascular endothelial cells: an alloimmune mechanism of chronic allograft nephropathy. J. Am. Soc. Nephrol. 15:2429–2439 10.1097/01.ASN.0000138237.42675.45 - DOI - PubMed

Publication types

MeSH terms