. 2010 May;30(9):2078-89.
doi: 10.1128/MCB.01651-09. Epub 2010 Feb 22.

Cell-specific determinants of peroxisome proliferator-activated receptor gamma function in adipocytes and macrophages

Affiliations

Cell-specific determinants of peroxisome proliferator-activated receptor gamma function in adipocytes and macrophages

Martina I Lefterova et al. Mol Cell Biol. 2010 May.

Abstract

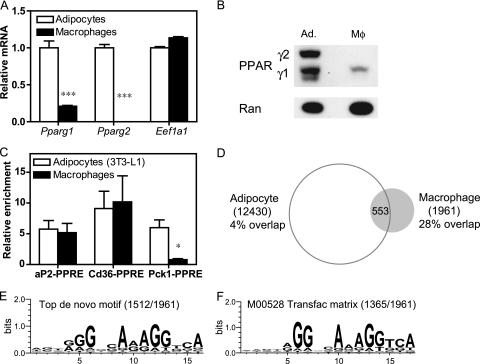
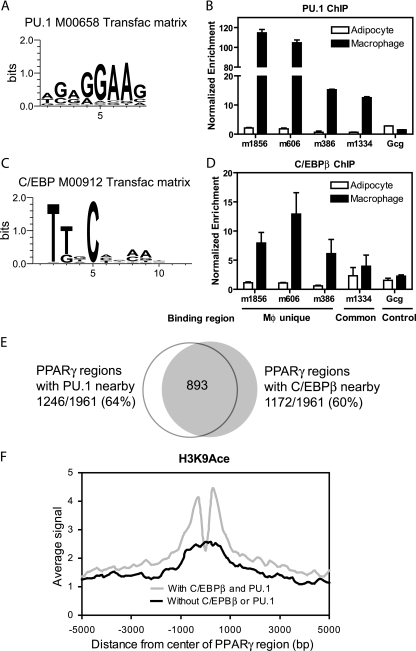
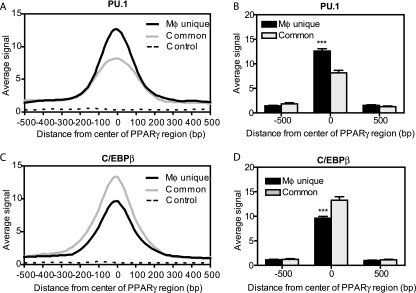
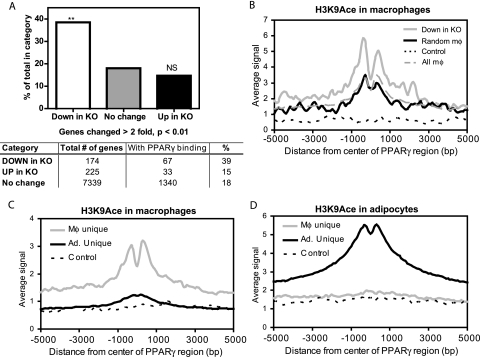
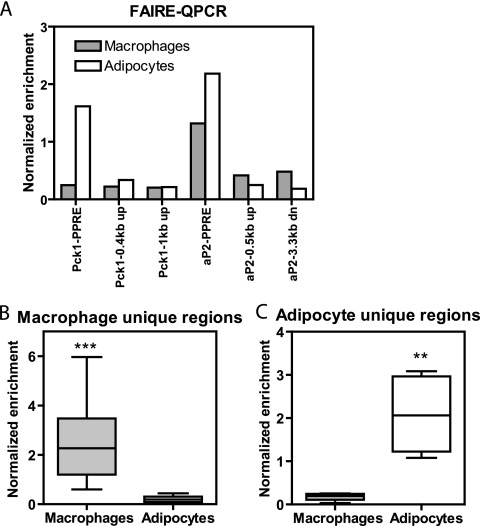
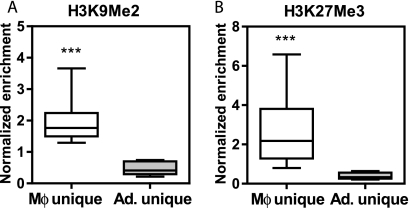
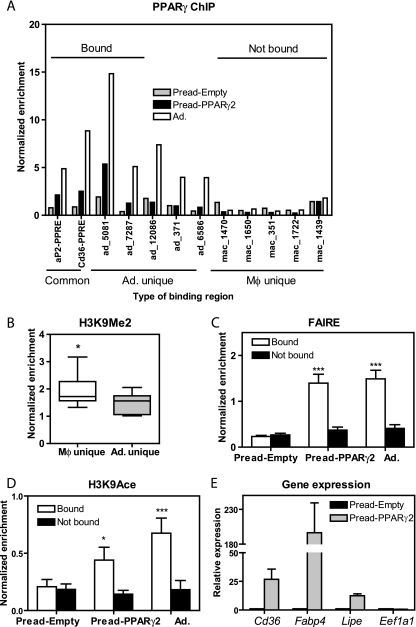
The nuclear receptor peroxisome proliferator activator receptor gamma (PPARgamma) is the target of antidiabetic thiazolidinedione drugs, which improve insulin resistance but have side effects that limit widespread use. PPARgamma is required for adipocyte differentiation, but it is also expressed in other cell types, notably macrophages, where it influences atherosclerosis, insulin resistance, and inflammation. A central question is whether PPARgamma binding in macrophages occurs at genomic locations the same as or different from those in adipocytes. Here, utilizing chromatin immunoprecipitation and high-throughput sequencing (ChIP-seq), we demonstrate that PPARgamma cistromes in mouse adipocytes and macrophages are predominantly cell type specific. In thioglycolate-elicited macrophages, PPARgamma colocalizes with the hematopoietic transcription factor PU.1 in areas of open chromatin and histone acetylation, near a distinct set of immune genes in addition to a number of metabolic genes shared with adipocytes. In adipocytes, the macrophage-unique binding regions are marked with repressive histone modifications, typically associated with local chromatin compaction and gene silencing. PPARgamma, when introduced into preadipocytes, bound only to regions depleted of repressive histone modifications, where it increased DNA accessibility, enhanced histone acetylation, and induced gene expression. Thus, the cell specificity of PPARgamma function is regulated by cell-specific transcription factors, chromatin accessibility, and histone marks. Our data support the existence of an epigenomic hierarchy in which PPARgamma binding to cell-specific sites not marked by repressive marks opens chromatin and leads to local activation marks, including histone acetylation.


Figures

FIG. 1.
FIG. 1.
PPARγ binding in macrophages compared to adipocytes. (A) Gene expression analysis by QPCR of the Pparg1 and Pparg2 isoforms in thioglycolate-elicited macrophages and differentiated 3T3-L1 adipocytes. Eukaryotic translation elongation factor 1 alpha 1 (Eef1a1) was used as a negative control. Data were normalized to the housekeeping gene Pabpc1 and are presented as mean ± standard error (n = 3 to 4). ***, P < 0.001. (B) Immunoblot analysis demonstrating PPARγ abundance in macrophages (Mφ) and adipocytes (Ad.), using Ran as a loading control. The migration of the PPARγ1 and PPARγ2 isoforms is indicated. (C) ChIP-QPCR analysis of PPARγ enrichment at the known PPARγ response elements (PPRE) near the aP2, Cd36, and Pck1 genes. Data were normalized to a nontarget genomic site and are presented as mean ± standard error (n = 3 to 4). *, P < 0.05, unpaired t test. (D) Venn diagram representing the overlap of macrophage and adipocyte PPARγ cistromes, i.e., those having at least 1 bp in common. The adipocyte data set is the union of a ChIP-seq experiment performed in this study and the previously published data sets using ChIP-seq (53) and ChIP-chip (40). (E and F) Highest scoring sequence motifs from de novo motif analysis (E) and known motif analysis (F). Indicated in parentheses is the number of macrophage PPARγ-binding regions that contain the motif. x axes, residue number within motif.
FIG. 2.
FIG. 2.
PPARγ colocalizes in a macrophage-specific manner with C/EBPβ and PU.1. (A) Example of a PU.1/Ets TRANSFAC matrix enriched in the PPARγ-binding regions in macrophages. (B) ChIP-QPCR analysis of PU.1 enrichment in adipocytes and macrophages at several PPARγ-binding regions predicted to have PU.1 colocalization. Data were normalized to a nontarget genomic site and are presented as mean ± standard deviation (n = 2). (C) Example of a C/EBP TRANSFAC matrix enriched in the PPARγ-binding regions in macrophages. (D) ChIP-QPCR analysis of C/EBPβ enrichment as for panel B. Indicated are the regions that are bound by PPARγ only in macrophages (Mφ unique), a region bound by PPARγ in both cell types (Common), and a negative-control site at the glucagon TSS (Gcg, Control). (E) Venn diagram representing the overlap between the sets of macrophage PPARγ-binding regions with PU.1 and C/EBPβ, i.e., those having at least 1 bp in common. (F) Average profiles of H3K9Ace ChIP-seq signals around macrophage PPARγ-binding regions that have colocalization with both PU.1 and C/EBPβ (n = 776) or neither factor (n = 516). All profiles are centered at the middle 1 bp of the binding regions. The average signal represents the average number of reads across a category of binding regions per 100-bp interval.
FIG. 3.
FIG. 3.
Differential PU.1 and C/EBP enrichment at macrophage-unique versus common PPARγ-binding regions. (A) Average profile of PU.1 ChIP-seq signals in macrophages around PPARγ-binding regions that are either unique to macrophages (Mφ unique, n = 1,408) or shared with adipocytes (common, n = 553), as well as at control genomic regions (control, n = 600). The average signal represents the average number of reads per 20-bp segment over a 1-kb distance, centered on the middle 1 bp of the PPARγ-binding regions. (B) Comparison of average PU.1 signals between Mφ unique (n = 1,408) and Common (n = 553) regions at the middle 1 bp of the PPARγ-binding regions and 500 bp downstream and upstream. (C) Average profile of C/EBPβ ChIP-seq signals in macrophages around PPARγ-binding regions as for panel A. (D) Comparison of average C/EBPβ signal between Mφ unique and common regions at the middle 1 bp of the PPARγ-binding regions and 500 bp downstream and upstream as for panel C. ***, P < 0.001, unpaired t test.
FIG. 4.
FIG. 4.
PPARγ binding correlates with PPARγ-dependent gene expression and histone acetylation. (A) Percentage of genes that have a PPARγ binding site within 100 kb of the TSS among the genes that are downregulated (down in KO), upregulated (up in KO), or unchanged (no change) in PPARγ-deficient macrophages (KO) compared to wild-type controls, described previously (29). **, P < 0.01 and NS (not significant) versus “no change,” Fisher's exact test. (B) Average H3K9Ace profiles for the 96 macrophage PPARγ-binding regions located within 100 kb of downregulated genes (down in KO), 96 macrophage regions selected at random from the entire set of macrophage PPARγ-binding regions (random mφ), 96 negative-control regions (control), and the entire set of 1,961 macrophage PPARγ-binding regions (all mφ). Distances from the centers of the binding regions are shown in base pairs (bp). (C and D) Genome-wide H3K9Ace in macrophages (C) and in adipocytes (D). Average profiles of H3K9Ace ChIP-seq signal around three categories of PPARγ-binding regions: macrophage (Mφ) unique (n = 1,408), adipocyte (Ad.) unique (n = 11,892), and genomic regions where no binding was detected for PPARγ in either cell type (control) (n = 500). All profiles are centered at the middle 1 bp of the binding regions. The average signal represents the average number of reads across a category of binding regions per 100-bp interval.
FIG. 5.
FIG. 5.
PPARγ correlates with DNA accessibility in a cell-type-specific manner. (A) FAIRE-QPCR at aP2-PPRE and Pck1-PPRE and two downstream (dn) and/or upstream (up) regions for each PPRE. Enrichment in macrophages and adipocytes was normalized to a control genomic region. (B and C) Box-whisker plots of FAIRE-QPCR in macrophages and adipocytes at macrophage-unique regions (n = 13) and adipocyte (Ad.) unique regions (n = 6). Enrichment was normalized as for panel A and measured in two to four biological replicates, **, P < 0.01; ***, P < 0.001, paired t test.
FIG. 6.
FIG. 6.
Evidence of chromatin silencing in adipocytes at macrophage-unique PPARγ-binding regions. (A) H3K9Me2. (B) H3K27Me3. Box-whisker plots of ChIP-QPCR enrichment of the repressive chromatin marks H3K9Me2 and H3K27Me3 in adipocytes at macrophage (Mφ) unique (n = 13) and adipocyte (Ad.) unique (n = 9) regions. Enrichment at target sites was normalized to a control genomic region and was measured in three biological replicates for each cell type. *, P < 0.05; ***, P < 0.001, unpaired t test.
FIG. 7.
FIG. 7.
PPARγ binding induces open chromatin and histone acetylation. (A) ChIP-QPCR at three types of PPARγ-binding regions: common (n = 2), adipocyte (Ad.) unique (n = 5), and macrophage (Mφ) unique (n = 5). Enrichment was normalized as in Fig. 1C and measured in mature adipocytes (Ad.) and in preadipocytes transduced with pMSCV-Empty virus (Pread-Empty) or pMSCV-PPARγ2 (Pread-PPARγ2). “Bound” refers to the adipocyte regions that were occupied by PPARγ in Pread-PPARγ2 (n = 4); “not bound” refers to five macrophage regions that show no recruitment in Pread-PPARγ2 and Ad. (B) H3K9Me2 in preadipocytes, analyzed as in Fig. 6A. (C) FAIRE-QPCR at the four regions bound by PPARγ in Pread-PPARγ2 (“bound,” in panel A) and compared to the five macrophage-unique regions (“not bound” in panel A). The same comparison was carried out for Pread-Empty and Ad.; *** P < 0.001, two-way analysis of variance (ANOVA) (bound versus not bound). (D) H3K9Ace ChIP-QPCR at the same bound (n = 4) and not bound (n = 5) PPARγ regions in preadipocytes transduced with pMSCV-PPARγ2 (Pread-PPARγ2) or pMSCV-Empty retrovirus (Pread-Empty), and mature adipocytes (Ad.); *, P < 0.05, ***, P < 0.001, two-way ANOVA (bound versus not bound). (E) QPCR analysis of PPARγ target gene expression in Pread-PPARγ2 and Pread-Empty. The genes that were examined are Cd36, aP2/Fabp4, Lipe/HSL, and eukaryotic translation elongation factor 1 alpha 1 (Eef1a1) as a negative control. Data were normalized to the housekeeping gene Pabpc1 and are presented as mean ± standard deviation (n = 2).

Similar articles

Cited by

References

    1. Akira, S., H. Isshiki, T. Sugita, O. Tanabe, S. Kinoshita, Y. Nishio, T. Nakajima, T. Hirano, and T. Kishimoto. 1990. A nuclear factor for IL-6 expression (NF-IL6) is a member of a C/EBP family. EMBO J. 9:1897-1906. - PMC - PubMed
    1. Barrera, L. O., Z. Li, A. D. Smith, K. C. Arden, W. K. Cavenee, M. Q. Zhang, R. D. Green, and B. Ren. 2008. Genome-wide mapping and analysis of active promoters in mouse embryonic stem cells and adult organs. Genome Res. 18:46-59. - PMC - PubMed
    1. Barski, A., S. Cuddapah, K. Cui, T. Y. Roh, D. E. Schones, Z. Wang, G. Wei, I. Chepelev, and K. Zhao. 2007. High-resolution profiling of histone methylations in the human genome. Cell 129:823-837. - PubMed
    1. Biddie, S. C., S. John, and G. L. Hager. 2010. Genome-wide mechanisms of nuclear receptor action. Trends Endocrinol. Metab. 21:3-9. - PMC - PubMed
    1. Bouhlel, M. A., B. Derudas, E. Rigamonti, R. Dievart, J. Brozek, S. Haulon, C. Zawadzki, B. Jude, G. Torpier, N. Marx, B. Staels, and G. Chinetti-Gbaguidi. 2007. PPARgamma activation primes human monocytes into alternative M2 macrophages with anti-inflammatory properties. Cell Metab. 6:137-143. - PubMed

Publication types

MeSH terms