. 2010 Mar;135(3):173-96.
doi: 10.1085/jgp.200910322.

Diffusion of a soluble protein, photoactivatable GFP, through a sensory cilium

Affiliations

Diffusion of a soluble protein, photoactivatable GFP, through a sensory cilium

Peter D Calvert et al. J Gen Physiol. 2010 Mar.

Abstract

Transport of proteins to and from cilia is crucial for normal cell function and survival, and interruption of transport has been implicated in degenerative and neoplastic diseases. It has been hypothesized that the ciliary axoneme and structures adjacent to and including the basal bodies of cilia impose selective barriers to the movement of proteins into and out of the cilium. To examine this hypothesis, using confocal and multiphoton microscopy we determined the mobility of the highly soluble photoactivatable green fluorescent protein (PAGFP) in the connecting cilium (CC) of live Xenopus retinal rod photoreceptors, and in the contiguous subcellular compartments bridged by the CC, the inner segment (IS) and the outer segment (OS). The estimated axial diffusion coefficients are D(CC) = 2.8 +/- 0.3, D(IS) = 5.2 +/- 0.6, and D(OS) = 0.079 +/- 0.009 microm(2) s(-1). The results establish that the CC does not pose a major barrier to protein diffusion within the rod cell. However, the results also reveal that axial diffusion in each of the rod's compartments is substantially retarded relative to aqueous solution: the axial diffusion of PAGFP was retarded approximately 18-, 32- and 1,000-fold in the IS, CC, and OS, respectively, with approximately 20-fold of the reduction in the OS attributable to tortuosity imposed by the lamellar disc membranes. Previous investigation of PAGFP diffusion in passed, spherical Chinese hamster ovary cells yielded D(CHO) = 20 microm(2) s(-1), and estimating cytoplasmic viscosity as D(aq)/D(CHO) = 4.5, the residual 3- to 10-fold reduction in PAGFP diffusion is ascribed to sub-optical resolution structures in the IS, CC, and OS compartments.


Figures
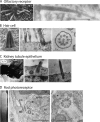
Figure 1.
Figure 1.
Ultrastructures of a sampling of primary cilia. (A) Olfactory receptor cilia contain the molecular machinery of odorant transduction. Defects in ciliary genes lead to anosmia (Kulaga et al., 2004). (Left) Scanning EM of an embryonic rat olfactory receptor dendritic knob with multiple primary cilia (reproduced from Menco, 1997 with permission of Oxford University Press). (Right) Longitudinal section through an olfactory cilium (reproduced from Menco et al., 1997 [fig. 6] with permission from Springer Science and Business Media). Bar, 1 µm. (B) Hair cells are mechanoreceptors. They generally have only one true cilium, the kinocilium, the longest structure found at the back of the ciliary bundle. Defects in ciliary genes lead to reduced hearing and deafness, such as in Usher’s syndrome. (Left) Scanning EM of stereocilia from a frog saccule (reproduced from Vollrath et al., 2007 with permission). Bar, 1 µm. (Middle and right) Sections through the kinocilia of teleost fish (reproduced from Flock and Duvall, 1965 with permission). (Middle) Longitudinal section through the kinocilium base. Bar, 0.5 µm. (Right) Cross section showing a 9 + 2 axonemal structure. Bar, 0.1 µm. (C) Kidney tubule epithelial cells possess single cilia, whose function remains unknown, but it has been proposed that they serve some sensory role, such as the detection of fluid flow. Mutations in cilia genes lead to polycystic kidney disease and loss of renal function. (Left) Scanning EM of mouse kidney tubule epithelial cells showing several cilia projecting into the lumen (Pazour et al., 2000). (Middle and right) Longitudinal sections through the base of the cilia showing the basal body and centriole (reproduced from Ganote et al., 1968 with permission). (D) Photoreceptors in the retina are modified cilia that transduce light into visual signals. The OSs contain opsin molecules that absorb photons and pass the light signal down a transduction cascade that leads to channel closure in the plasma membrane. Mutations in ciliary genes lead to retinal degeneration and blindness, such as in retinitis pigmentosa. (Left) Scanning EM of a frog rod. (Middle) Longitudinal section through the CC showing the basal body and the associated centriole. Note the lamellar discs (D) of the OS and the mitochondria (M) of the IS compartments. Bar, 1 µm. (Right) Cross section of the CC just distal to the basal body. Bar, 0.5 µm. Images reproduced from Peters et al. (1983) with permission.
Figure 2.
Figure 2.
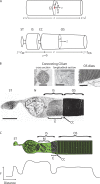
Coordinate systems and structural features of rod photoreceptors important for analyzing molecular motion. (A) Coordinate systems. (Top) The cylindrical coordinate system used in the 3-D model of diffusion in the OS and IS compartments. (Bottom) Coordinates used in the 1-D model of intercompartment diffusion (see Theory). (B) Transmission EM of a rod. A thin section along the central axis of a rod cell isolated from salamander retina showing the axial variation in the density of structures within the major rod compartments. OS, outer segment; IS, inner segment; E, mitochondria-filled ellipsoid; M, myoid; N, nucleus; ST, synaptic terminal; CC, connecting cilium (approximate position). The distal outer segment was truncated in this image. Bar, 10 µm. (CC inset; left) Cross section of a rat rod CC showing the 9 + 0 microtubule motif and the close juxtaposition of the plasma membrane, reproduced from Besharse et al. (1985) with permission. Bar, 0.3 µm. (Right) Longitudinal section of a frog rod CC (reproduced from Peters et al., 1983 with permission). Bar, 1.0 µm. (OS discs inset) Detail showing the stack of membranous discs orthogonal to the axis of the rod. Bar, 1 µm. The isolated rod and the OS disc inset are from Townes-Anderson et al. (1985). (C) Effect of suboptical resolution structures on fluorescence intensity. The presence of structural inhomogeneities of rods in the volume of the psf result in variation in recorded GFP fluorescence, even when the aqueous concentration (green color) of the protein is uniform. Red circles in the top panel illustrate a cross section of the psf in an x–y image plane of a rod that is occupied to varying degrees by different densities of subcellular structures. The bottom panel illustrates the expected variation in fluorescence (F) (compare Peet et al., 2004).
Figure 3.
Figure 3.
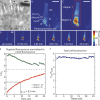
Equilibration of PAGFP throughout the cytoplasm of a rod after photoactivation in the IS. (A) Infrared image of the retinal slice before experiment. The rod in which PAGFP was photoconverted is indicated by the arrowhead. (B–D) All images were obtained with the microscope operating in confocal mode, with the power of the 488-nm argon ion laser line attenuated to 2 µW (at the sample). (B) Initial fluorescence distribution of PAGFP in the central z image of the rod, intensity scaled to more clearly show the cell structure. The red dot in the center of the image is an overlay of the field intensity profile of the psf, indicating the spatial position in xy and the dimensions of the multiphoton photoconversion pulse. OS, outer segment; IS, inner segment; N, nucleus; S, synaptic region. (C) The final time series image of the rod (25.5 min from the onset of photoconversion), where the boundary between the IS and OS was more clearly identifiable, was used to delineate regions (red polygons) over which fluorescence levels were integrated in each of the time series images. See results for details of the analysis. (D) Selected images of the fluorescence time series, starting with an image taken just before the photoconversion exposure. Photoconversion was effected by a 100-ms, 20-mW (at the sample) pulse from the Ti:S laser tuned to 820 nm. The times in subsequent images are measured from the moment of pulse initiation. The color bar to the right codes the fluorescence intensity in photon counts and is relevant to the images in C and D only. (E) The integrated fluorescence (F) in the OS (Region 1 in C) and the IS (Region 2 in C), normalized to the integrated fluorescence within the respective region just before photoconversion (F0), as a function of time after the photoconversion pulse. The dashed line drawn at F/F0 = 5.3 indicates the time-averaged magnitude of total cell fluorescence increase post-photoconversion, and thus represents the value of F/F0 expected for all compartments upon equilibration (see Fig. 5 and Results for details). T1/2 is the time required for the OS compartment to reach 1/2 the F/F0 value at equilibrium. (F) Integrated fluorescence over the entire cell image normalized to the integrated prepulse fluorescence (Ftot/Ftot,0), as a function of time from pulse onset. The total post-pulse fluorescence remains within ∼7% of the median post-pulse value. (A–D) Bars, 10 µm. See Video 1.
Figure 4.
Figure 4.
PAGFP diffusion in IS subcompartments. (A) The cell illustrated in Fig. 3 with fluorescence analayzed in the IS subcompartments indicated by red polygons. The red dot shows the site of PAGFP activation. (B) Selected images from the time series in Fig. 3 shown at a higher frequency and enlarged to reveal the dynamics of photoconverted PAGFP in the IS region. The color bar is relevant to images in B only. (C) Integrated fluorescence in each of the regions defined in A, normalized to the integrated fluorescence of the respective regions in the prepulse image. Dashed line indicates the expected equilibrium level (see Fig. 3), which will only be reached when the slowly equilibrating OS is finally at equilibrium. (A and B) Bar, 10 µm.
Figure 5.
Figure 5.
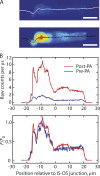
The prediction of uniform scaling of fluorescence after photoconversion holds. (A) Images of the cell from Fig. 3 before and 50 min after the photoconversion (PA) exposure. The lines in the images indicate positions along which fluorescence counts were acquired and compared in B. (B) In the top panel, the raw fluorescence counts along the lines indicated in A are plotted as a function of distance relative to the IS–OS junction. The bottom panel plots the fluorescence normalized to the average of the brightest 5% of the voxels in each 3-D scan (F0).
Figure 6.
Figure 6.
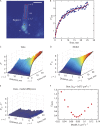
PAGFP equilibration in the myoid is isotropic and rapid. (A) x–y image of the region of retinal slice at the central z level of the cell that was the subject of the experiment. The region of the cell that was rapidly scanned before and after a 100-µs photoconversion pulse (the location of which is in the myoid, indicated by the red symbol) is delineated by the green box. (B) Pre-conversion scan of the region showing subregions where time courses of fluorescence change were recorded (red boxes). (C) Selected time course images showing the rapid myoid equilibration. (D) Time courses of fluorescence changes recorded from the regions shown in B. Note that the axial and radial regions change in parallel and ultimately merge with the fluorescence time course from region 1, the site of photoconversion, at ∼1.5 s. See Video 2.
Figure 7.
Figure 7.
Equilibration of PAGFP in the OS compartment is highly anisotropic. (A) x–y image of the region of retinal slice showing the central z level of the cell at which the experiment was performed. The region of the OS that was rapidly scanned before and after a 100-µs photoconversion pulse (indicated by the red symbol) is delineated by the green box. (B) Prepulse scan of the region showing subregions where time courses of fluorescence change were recorded (red boxes). (C) Selected time course images showing the rapid radial and slower axial equilibration. (D) Time courses of fluorescence changes recorded from the regions shown in B. Radial positions 2 and 3 changed approximately in parallel and merge with the fluorescence time course from region 1, the site of photoconversion, within ∼2 s. The fluorescence at axial positions 4 and 5 required much longer, >15 s, to merge with the fluorescence of region 1, demonstrating the high degree of anisotropy in PAGFP diffusion in the OS. See Video 3.
Figure 8.
Figure 8.
Flux of PAGFP through the CC. (A) Pre-photoconversion image of a rod showing the regions where fluorescence was monitored over time. (B) Relative concentration of photoactivated PAGFP in the IS (region 2) and OS (region 3) after an IS photoconversion pulse. (C) The concentration gradient (red line, left ordinate) and flux (blue line, right ordinate) of PAGFP between IS and OS compartments. (D) The “flux constant” (Eq. 10) as a function of time. Gray line indicates the average value over the first 6.5 min (0.52 µm3 s−1), after which the cIS-cOS difference fell below ∼10% of its original magnitude and became unreliable.
Figure 9.
Figure 9.
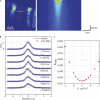
Estimation of the diffusion coefficient of PAGFP in the myoid. (A; left) x–y image of the region of retinal slice showing the z level of the cell on which the experiment was performed. The region of the myoid that was exposed to a 100-µs photoconversion pulse is indicated by the red symbol. The green line indicates the location of 2-KHz line scans that intersected the photoconversion site. (Right) The spatiotemporal fluorescence map of the dissipation of the photoconverted PAGFP from the photoconversion site. (B) Fluorescence profiles of selected line scans after normalizing to the amplitude of the first post-pulse line scan recorded (1.176 ms). The red lines are the result of model calculations with optimal D. (C) Root mean square (RMS) error calculated from the difference between line scan fluorescence and model prediction for indicated D. Minimal ERMS was achieved with D = 5 µm2 s−1.
Figure 10.
Figure 10.
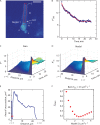
Estimation of the axial diffusion coefficient of PAGFP in the OS compartment. (A) The spatiotemporal profile of activated PAGFP filling of the OS was obtained from the region bounded by the red box. (B) The Dirichlet BC used in calculations was defined by fitting FDB(t) for n = 5 pixels in z (filled circles) with a sixth-order polynomial (red line). (C) The spatiotemporal profile of activated PAGFP. (D) Eqs. 13–15 were solved with varying D to find the best approximation of the spatiotemporal profile in C. Shown is the model profile, Fm(z,t), obtained from the solution of best fit. The thick black lines in C and D represent the Dirichlet boundary. (E) The data profile was subtracted from the model profile obtained for each value of DOS to determine the difference error. Shown is the difference for D = 0.075 µm2 s−1. (F) RMS error values plotted as a function of D.
Figure 11.
Figure 11.
Estimation of the axial diffusion coefficient of PAGFP within the CC using the 1-D model. (A) Region over which the fluorescence was averaged in the radial dimension from each time course image to produce the spatiotemporal fluorescence profile shown in C. Note that in this case the region begins at an axial position just proximal to the CC, z(cc). (B) To produce the Dirichlet BC the proximal five pixels in the region were averaged and fitted as described in Fig. 10. (C) Spatiotemporal map of fluorescence changes along the axial extent of the region shown in A. (D) Model prediction Fm(z,t) that best fitted the data. Eqs. 13–15 were solved with spatially varying D(z): D(z = IS), 5.2 µm2 s−1; D(z = OS), 0.08 µm2 s−1; D(z = CC) was varied to obtain the best fit of the model to the data. The thick black lines in C and D represent the Dirichlet boundary constraint. (E) Area of cross section versus axial distance profile, A(z), for the region of the cell analyzed and which was used in Eq. 13 to calculate model profiles; note the sharp drop in A at the CC. The red symbols denote the transitions between IS and CC (z(CCl); left symbol) and the CC and OS (z(CCL); right symbol), and define the ranges over which D(z) values described in D were applied. (F) RMS error values plotted as a function of DCC.
Figure 12.
Figure 12.
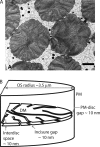
Morphology of OS discs. (A) Enface transmission electron micrographs of discs in the OSs of the bull frog Rana catesbeiana. Bar, 1.5 µm. Discs in rod photoreceptors have a scalloped morphology formed by infoldings called “incisures” that penetrate deep into their radial dimension. R, red rod; G, green rod. Image reprinted from Tsukamoto (1987) with permission from Elsevier. (B) Schematic of half of a rod OS, showing two disc membranes (DM) and the plasma membrane (PM) architecture. Average measurements used to calculate the patent area of cross section available for axial diffusion of molecules are indicated.
Figure 13.
Figure 13.
Impact of changes in areas of cross section on equilibration kinetics: predictions from the diffusion model. (A) Idealized cells with the geometry of frog or mouse rods and for an idealized ciliated cell for which equilibration time courses were modeled by solving Eqs. 13–15. The rod ISs or the cell body (CB) were initially uniformly filled with diffusing substance (black), and the OS and cilia were empty. Equilibration after some period of time is indicated by uniform gray in all compartments. Arrow thickness denotes relative speed of equilibration (see B–D). (B) Time courses of equilibration into rod OS compartments. The lengths of each compartment were: IS, 5 µm; CC, 0.8 µm; OS, 25 µm. The CC had the same diameter in all cases, 0.4 µm (average diameter from Table I). A range of rod IS and OS diameters were modeled, including 7 µm, representative of frog rods, and 1.4 µm, based on the most recent measurements of mouse rod dimensions (Daniele et al., 2005). In all cases, DIS = 5 µm2 s−1, DCC = 2 µm2 s−1, and DOS = 0.1 µm2 s−1. The mass in the OS normalized to the equilibrated OS mass is plotted. (C) Dependence of the T1/2 of equilibration on the ratio of CC and IS–OS radii. Line is drawn through the points. (D) Time course of cilium equilibration. Ciliated cells (10-µm long cell body and 5 µm in diameter, possessing a cilium 0.4 µm in diameter and varied length) were modeled. The mass of the diffusing substance in the cilium normalized to the equilibrated mass is plotted for cilia of indicated length.

Similar articles

Cited by

References

    1. Badano J.L., Mitsuma N., Beales P.L., Katsanis N. 2006. The ciliopathies: an emerging class of human genetic disorders. Annu. Rev. Genomics Hum. Genet. 7:125–148 10.1146/annurev.genom.7.080505.115610 - DOI - PubMed
    1. Besharse J.C., Forestner D.M., Defoe D.M. 1985. Membrane assembly in retinal photoreceptors. III. Distinct membrane domains of the connecting cilium of developing rods. J. Neurosci. 5:1035–1048 - PMC - PubMed
    1. Blacque O.E., Perens E.A., Boroevich K.A., Inglis P.N., Li C., Warner A., Khattra J., Holt R.A., Ou G., Mah A.K., et al. 2005. Functional genomics of the cilium, a sensory organelle. Curr. Biol. 15:935–941 10.1016/j.cub.2005.04.059 - DOI - PubMed
    1. Broekhuyse R.M., Tolhuizen E.F., Janssen A.P., Winkens H.J. 1985. Light induced shift and binding of S-antigen in retinal rods. Curr. Eye Res. 4:613–618 10.3109/02713688508999993 - DOI - PubMed
    1. Brown E.B., Wu E.S., Zipfel W., Webb W.W. 1999. Measurement of molecular diffusion in solution by multiphoton fluorescence photobleaching recovery. Biophys. J. 77:2837–2849 10.1016/S0006-3495(99)77115-8 - DOI - PMC - PubMed

Publication types

MeSH terms

Substances