

A homology model of the pore domain of a voltage-gated calcium channel is consistent with available SCAM data
- PMID: 20176854
- PMCID: PMC2828909
- DOI: 10.1085/jgp.200910288
A homology model of the pore domain of a voltage-gated calcium channel is consistent with available SCAM data
Abstract
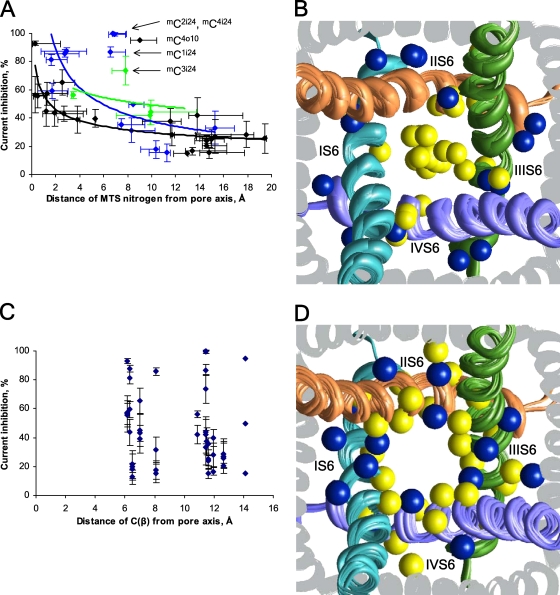
In the absence of x-ray structures of calcium channels, their homology models are used to rationalize experimental data and design new experiments. The modeling relies on sequence alignments between calcium and potassium channels. Zhen et al. (2005. J. Gen. Physiol. doi:10.1085/jgp.200509292) used the substituted cysteine accessibility method (SCAM) to identify pore-lining residues in the Ca(v)2.1 channel and concluded that their data are inconsistent with the symmetric architecture of the pore domain and published sequence alignments between calcium and potassium channels. Here, we have built K(v)1.2-based models of the Ca(v)2.1 channel with 2-(trimethylammonium)ethyl methanethiosulfonate (MTSET)-modified engineered cysteines and used Monte Carlo energy minimizations to predict their energetically optimal orientations. We found that depending on the position of an engineered cysteine in S6 and S5 helices, the ammonium group in the long flexible MTSET-modified side chain can orient into the inner pore, an interface between domains (repeats), or an interface between S5 and S6 helices. Different local environments of equivalent positions in the four repeats can lead to different SCAM results. The reported current inhibition by MTSET generally decreases with the predicted distances between the ammonium nitrogen and the pore axis. A possible explanation for outliers of this correlation is suggested. Our calculations rationalize the SCAM data, validate one of several published sequence alignments between calcium and potassium channels, and suggest similar spatial dispositions of S5 and S6 helices in voltage-gated potassium and calcium channels.
Figures
Similar articles
-
Functional architecture of the inner pore of a voltage-gated Ca2+ channel.J Gen Physiol. 2005 Sep;126(3):193-204. doi: 10.1085/jgp.200509292. J Gen Physiol. 2005. PMID: 16129770 Free PMC article.
-
Cysteine mutagenesis and computer modeling of the S6 region of an intermediate conductance IKCa channel.J Gen Physiol. 2002 Jul;120(1):99-116. doi: 10.1085/jgp.20028586. J Gen Physiol. 2002. PMID: 12084779 Free PMC article.
-
Structural determinants of the closed KCa3.1 channel pore in relation to channel gating: results from a substituted cysteine accessibility analysis.J Gen Physiol. 2007 Apr;129(4):299-315. doi: 10.1085/jgp.200609726. Epub 2007 Mar 12. J Gen Physiol. 2007. PMID: 17353352 Free PMC article.
-
Emerging issues of connexin channels: biophysics fills the gap.Q Rev Biophys. 2001 Aug;34(3):325-472. doi: 10.1017/s0033583501003705. Q Rev Biophys. 2001. PMID: 11838236 Review.
-
Molecular pore structure of voltage-gated sodium and calcium channels.Braz J Med Biol Res. 1994 Dec;27(12):2781-802. Braz J Med Biol Res. 1994. PMID: 7550000 Review.
Cited by
-
A molecular model of the inner pore of the Ca channel in its open state.Channels (Austin). 2011 Nov-Dec;5(6):482-8. doi: 10.4161/chan.5.6.18354. Epub 2011 Nov 1. Channels (Austin). 2011. PMID: 22020562 Free PMC article.
-
Design, In silico Screening, Synthesis, Characterisation and DFT-based Electronic Properties of Dihydropyridine-based Molecule as L-type Calcium Channel Blocker.Curr Comput Aided Drug Des. 2024;20(7):1130-1146. doi: 10.2174/0115734099273719231005062524. Curr Comput Aided Drug Des. 2024. PMID: 39354859
-
Possible Interactions of Extracellular Loop IVP2-S6 With Voltage-Sensing Domain III in Cardiac Sodium Channel.Front Pharmacol. 2021 Oct 14;12:742508. doi: 10.3389/fphar.2021.742508. eCollection 2021. Front Pharmacol. 2021. PMID: 34721031 Free PMC article.
-
Timothy mutation disrupts the link between activation and inactivation in Ca(V)1.2 protein.J Biol Chem. 2011 Sep 9;286(36):31557-64. doi: 10.1074/jbc.M111.255273. Epub 2011 Jun 17. J Biol Chem. 2011. PMID: 21685391 Free PMC article.
-
Possible roles of exceptionally conserved residues around the selectivity filters of sodium and calcium channels.J Biol Chem. 2011 Jan 28;286(4):2998-3006. doi: 10.1074/jbc.M110.175406. Epub 2010 Nov 16. J Biol Chem. 2011. PMID: 21081490 Free PMC article.
References
Publication types
MeSH terms
Substances
Grants and funding
LinkOut - more resources
Full Text Sources
