. 2010 May;54(5):2085-95.
doi: 10.1128/AAC.01460-09. Epub 2010 Feb 22.

Compensation of fitness costs and reversibility of antibiotic resistance mutations

Affiliations

Compensation of fitness costs and reversibility of antibiotic resistance mutations

Pia Schulz zur Wiesch et al. Antimicrob Agents Chemother. 2010 May.

Abstract

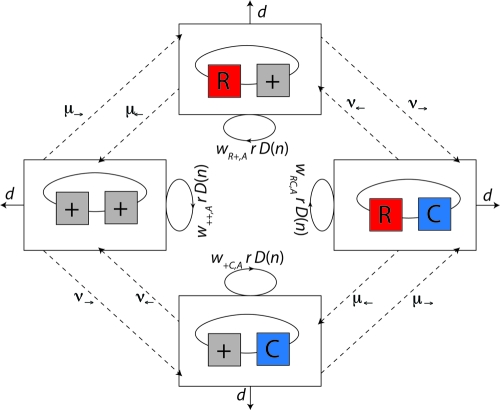
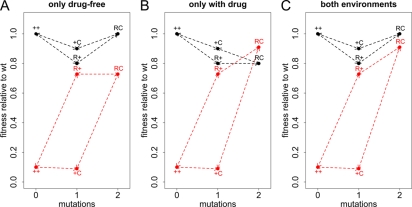
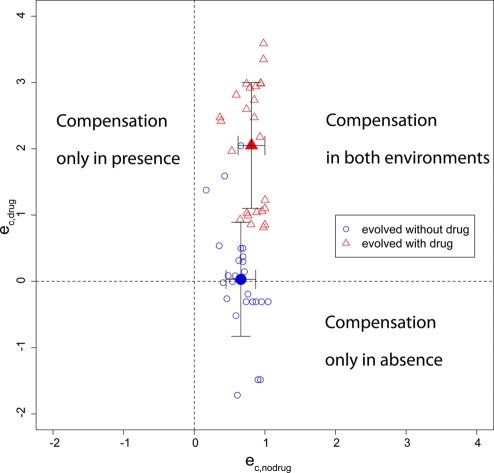
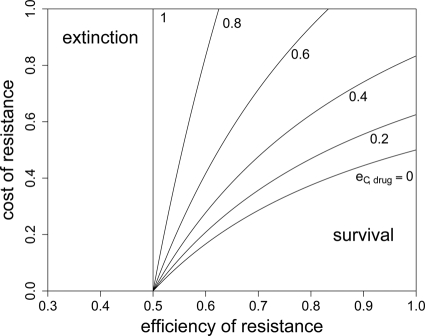
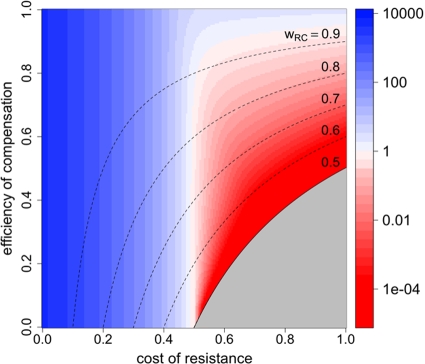
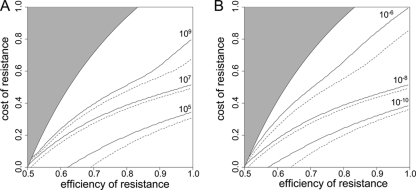
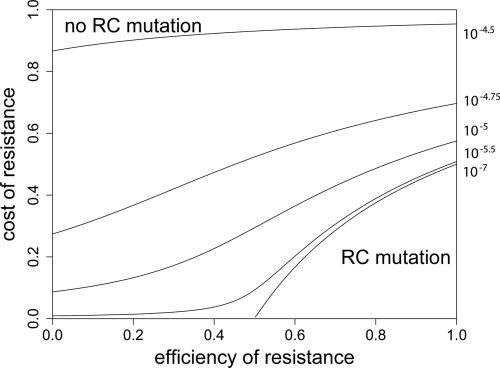
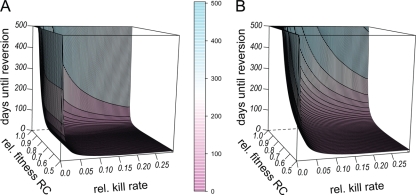
Strains of bacterial pathogens that have acquired mutations conferring antibiotic resistance often have a lower growth rate and are less invasive or transmissible initially than their susceptible counterparts. However, fitness costs of resistance mutations can be ameliorated by secondary site mutations. These so-called compensatory mutations may restore fitness in the absence and/or presence of antimicrobials. We review literature data and show that the fitness gains in the absence and presence of antibiotic treatment need not be correlated. The aim of this study is to gain a better conceptual grasp of how compensatory mutations with different fitness gains affect evolutionary trajectories, in particular reversibility. To this end, we developed a theoretical model with which we consider both a resistance and a compensation locus. We propose an intuitively understandable parameterization for the fitness values of the four resulting genotypes (wild type, resistance mutation only, compensatory mutation only, and both mutations) in the absence and presence of treatment. The differential fitness gains, together with the turnover rate and the mutation rate, strongly affected the success of antibacterial treatment, reversibility, and long-term abundance of resistant strains. We therefore propose that experimental studies of compensatory mutations should include fitness measurements of all possible genotypes in both the absence and presence of an antibiotic.


Figures

FIG. 1.
FIG. 1.
Diagram of model 1. We consider two loci, a resistance and a compensation locus, resulting in four possible genotypes: wild type (++), resistance mutation only (R+), compensatory mutation only (+C), and resistant-compensated genotype (RC). Each genotype is represented by a box. Strains of all genotypes die with a rate d (see solid lines leaving the boxes) and replicate depending on their individual fitness levels in the current environment, wij,A, and a density-dependent term, D(n), which corresponds to 1 minus the total population size divided by the carrying capacity formula image(see circular arrows). Mutations occur at rates μ and μ at the resistance locus and at rates ν and ν at the compensatory locus (see dotted lines between the boxes). In this notation, the subscript arrows denote the direction of mutation.
FIG. 2.
FIG. 2.
Types of compensatory mutations. The x axis shows how many mutations the genotype has compared to the wild type. The y axis shows the replicative fitness compared to that of the wild type. The fitness in the absence of drugs is shown in black, and the fitness in the presence of antibiotic treatment is shown in red. ++ denotes the wild type (wt), R+ the genotype with only the resistance mutation, C+ the genotype carrying only the compensatory mutation, and RC the resistant-compensated genotype. Three extreme types of compensation are possible. (A) The compensatory mutation may be beneficial only in the absence of drugs (eC,no drug = 1 and eC,drug = 0). (B) Conversely, compensation may occur only in the presence of treatment (eC,no drug = 0 and eC,drug = 1). (C) Finally, compensation may have the same efficiency in both environments (eC,no drug = 1 and eC,drug = 1). Other parameters take the following values: a = 0.9, cC = 0.1, cR = 0.2, and eR = 0.9.
FIG. 3.
FIG. 3.
Compensation in absence versus compensation in presence of antibiotics. The equations in Table 1 were used to derive eC,no drug and eC,drug from the data set of Paulander et al. (63). The blue empty circles indicate resistant compensated strains that evolved in the absence of drugs, and the red empty triangles indicate resistant compensated strains that evolved in the presence of an antibiotic. The filled symbols indicate the means with standard deviations.
FIG. 4.
FIG. 4.
RC fitness in the presence of treatment and extinction. In order to escape extinction during treatment, the fitness of the RC genotype needs to be above a certain threshold. This plot shows the maximal cost of resistance for a given eR and cR that permits long-term survival of the RC genotype. It was created by solving rwRC > d for cR, yielding cR < 1/(1 − eC,drug) − d/[r(1 − a + aeR)(1 − eC,drug)] as the condition for the bacteria to persist. The antimicrobial activity (a) has a value of 1.
FIG. 5.
FIG. 5.
Fitness of R+ and RC genotypes and minimal population size during treatment. In this plot, the color scale indicates the minimal population sizes during treatment for different cR and eC,drug values upon treatment initiation in a naive bacterial population of 107 organisms. The area in which the growth rate of the RC genotype is smaller than the death rate (i.e., where extinction is inevitable) is shaded in gray. The dashed lines represent fitness isoclines for the RC genotype. Other parameters take the following values: a = 1, cC = 0.1, cR = 0.2, eR = 0.9, eC,drug = 0.6, and μ = 10−8.
FIG. 6.
FIG. 6.
Mutation rate, population size, and extinction during treatment. These graphs show the minimal cR for which a bacterial population goes extinct for a given eR. Extinction is defined to occur when the total population size drops below 1 during antimicrobial therapy. The area in which the growth rate of the RC genotype is smaller than the death rate (i.e., where extinction is inevitable) is shaded in gray. The dashed lines correspond to an initially homogeneous wild-type population, while the solid lines correspond to a population that expanded from 103 cells to the population size at which treatment commenced. (A) Various initial population sizes (N0). (B) Various mutation rates (μ). Unless varied, parameters take the following values: a = 1, cC = 0.1, cR = 0.2, eR = 0.9, eC,drug = 0.6, μ = 10−8, and N0 = 107.
FIG. 7.
FIG. 7.
Probability of generating RC bacteria before R+ extinction. This graph shows for which maximal eR the probability that the R+ population becomes extinct before creating an RC genotype is larger than 95%. It was created by solving formula imagefor eR, yielding formula imagefor a = 1. The values of μ are given next to the corresponding curves. For mutation rates of ≥10−4.25, the RC genotype could always emerge. N0 = 107, ν = 10μ.
FIG. 8.
FIG. 8.
Reversion to susceptibility after cessation of treatment and relative to kill rate. In this figure, we show how the fitness of the RC genotype and the bacterial kill rate relative to the growth rate influence reversion to susceptibility. The initial population consisted of 109 bacteria of the R+ (A) or the RC (B) genotype. The x axis (horizontal) shows the relative kill rate, i.e., the kill rate divided by the growth rate, and the y axis shows the efficiency of compensation, and thus RC fitness relative to that of the wild type. On the z axis are the numbers of days until >95% of the population consisted of the wild-type genotype. Other parameters take the following values: a = 1, eR = 1, cR = 0.5, cC = 0.5, eR = 1, μ = 10−8, and N0 = 109.

References

    1. Alekshun, M. N., and S. B. Levy. 2007. Molecular mechanisms of antibacterial multidrug resistance. Cell 128:1037-1050. - PubMed
    1. Andersson, D. I. 2003. Persistence of antibiotic resistant bacteria. Curr. Opin. Microbiol. 6:452-456. - PubMed
    1. Andersson, D. I. 2006. The biological cost of mutational antibiotic resistance: any practical conclusions? Curr. Opin. Microbiol. 9:461-465. - PubMed
    1. Andersson, D. I., and B. R. Levin. 1999. The biological cost of antibiotic resistance. Curr. Opin. Microbiol. 2:489-493. - PubMed
    1. Appelbaum, P. C. 2006. The emergence of vancomycin-intermediate and vancomycin-resistant Staphylococcus aureus. Clin. Microbiol. Infect. 12(Suppl. 1):16-23. - PubMed

Substances