

Pharmacokinetics of cefotaxime and desacetylcefotaxime in infants during extracorporeal membrane oxygenation
- PMID: 20176908
- PMCID: PMC2863660
- DOI: 10.1128/AAC.01696-09
Pharmacokinetics of cefotaxime and desacetylcefotaxime in infants during extracorporeal membrane oxygenation
Abstract
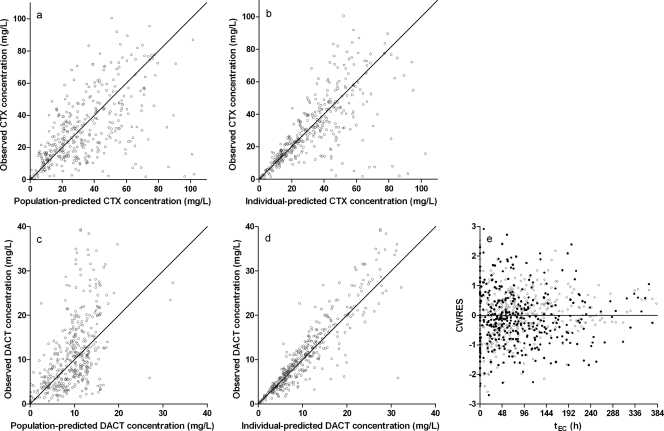
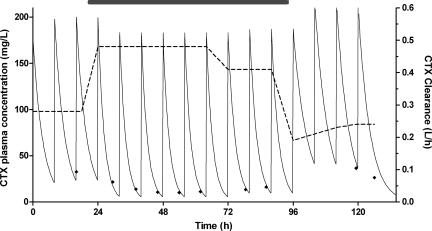
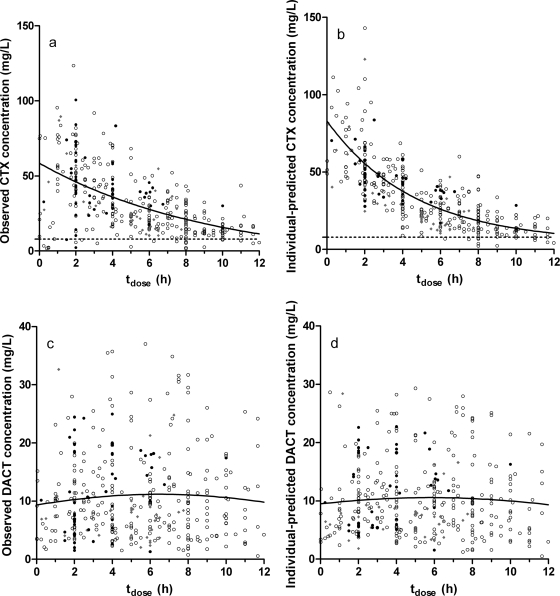
Extracorporeal membrane oxygenation (ECMO) is used to temporarily sustain cardiac and respiratory function in critically ill infants but can cause pharmacokinetic changes necessitating dose modifications. Cefotaxime (CTX) is used to prevent and treat infections during ECMO, but the current dose regimen is based on pharmacokinetic data obtained for non-ECMO patients. The objective of this study was to validate the standard dose regimen of 50 mg/kg of body weight twice a day (postnatal age [PNA], <1 week), 50 mg/kg three times a day (PNA, 1 to 4 weeks), or 37.5 mg/kg four times a day (PNA, >4 weeks). We included 37 neonates on ECMO, with a median (range) PNA of 3.3 (0.67 to 199) days and a median (range) body weight of 3.5 (2.0 to 6.2) kg at the onset of ECMO. Median (range) ECMO duration was 108 (16 to 374) h. Plasma samples were taken during routine care, and pharmacokinetic analysis of CTX and its active metabolite, desacetylcefotaxime (DACT), was done using nonlinear mixed-effects modeling (NONMEM). A one-compartment pharmacokinetic model for CTX and DACT adequately described the data. During ECMO, CTX clearance (CL(CTX)) was 0.36 liter/h (range, 0.19 to 0.75 liter/h), the volume of distribution of CTX (V(CTX)) was 1.82 liters (0.73 to 3.02 liters), CL(DACT) was 1.46 liters/h (0.48 to 5.93 liters/h), and V(DACT) was 11.0 liters (2.32 to 28.0 liters). Elimination half-lives for CTX and DACT were 3.5 h (1.6 to 6.8 h) and 5.4 h (0.8 to 14 h). Peak CTX concentration was 98.0 mg/liter (33.2 to 286 mg/liter). DACT concentration varied between 0 and 38.2 mg/liter, with a median of 10 mg/liter in the first 12 h postdose. Overall, CTX concentrations were above the MIC of 8 mg/liter over the entire dose interval. Only 1 of the 37 patients had a sub-MIC concentration for over 50% of the dose interval. In conclusion, the standard cefotaxime dose regimen provides sufficiently long periods of supra-MIC concentrations to provide adequate treatment of infants on ECMO.
Figures
References
-
- Ahsman, M. J., M. Hanekamp, E. D. Wildschut, D. Tibboel, and R. A. Mathot. Population pharmacokinetics of midazolam and metabolites during venoarterial extracorporeal membrane oxygenation in neonates. Clin. Pharmacokinet., in press. - PubMed
-
- Anderson, B. J., K. Allegaert, and N. H. Holford. 2006. Population clinical pharmacology of children: modelling covariate effects. Eur. J. Pediatr. 165:819-829. - PubMed
-
- Bennett, C. C., and C. F. Davis. 2003. Evidence-based use of neonatal extracorporeal membrane oxygenation (ECMO). Curr. Paediatr. 2003:146-150.
MeSH terms
Substances
LinkOut - more resources
Full Text Sources
Medical
