. 2010 Feb 22;188(4):491-503.
doi: 10.1083/jcb.200908026.

Condensin complexes regulate mitotic progression and interphase chromatin structure in embryonic stem cells

Affiliations

Condensin complexes regulate mitotic progression and interphase chromatin structure in embryonic stem cells

Thomas G Fazzio et al. J Cell Biol. .

Abstract

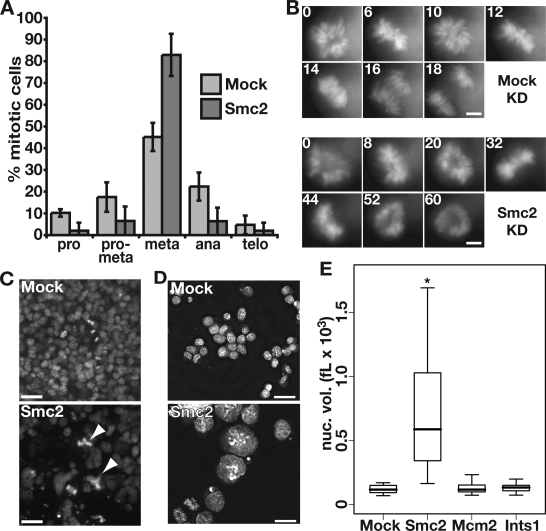
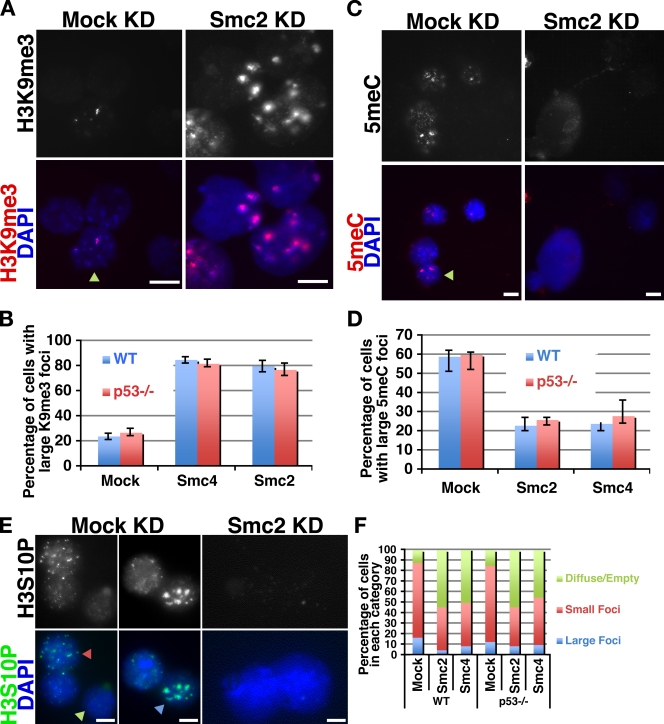
In an RNA interference screen interrogating regulators of mouse embryonic stem (ES) cell chromatin structure, we previously identified 62 genes required for ES cell viability. Among these 62 genes were Smc2 and -4, which are core components of the two mammalian condensin complexes. In this study, we show that for Smc2 and -4, as well as an additional 49 of the 62 genes, knockdown (KD) in somatic cells had minimal effects on proliferation or viability. Upon KD, Smc2 and -4 exhibited two phenotypes that were unique to ES cells and unique among the ES cell-lethal targets: metaphase arrest and greatly enlarged interphase nuclei. Nuclear enlargement in condensin KD ES cells was caused by a defect in chromatin compaction rather than changes in DNA content. The altered compaction coincided with alterations in the abundance of several epigenetic modifications. These data reveal a unique role for condensin complexes in interphase chromatin compaction in ES cells.


Figures

Figure 1.
Figure 1.
RNAi phenotypes of ES cells and iMEFs. (A) Proportion of TUNEL+ ES cells in KDs indicated. Means and standard deviations of triplicate samples are shown. (B) Colony morphology of ES cells depleted of the indicated proteins on day 4 of KD. Smc2, Mcm2, and Ints1 KDs exhibit a large number of rounded up and detached dead or dying cells. (C) Western blots for Smc2, Mcm, Ints1, and actin in ES cells depleted of the indicated proteins for 4 d. The arrow indicates Mcm2 in the pan-Mcm blot. (D) Morphology of iMEFs depleted of the indicated proteins. Cells were transfected on days 0, 2, 5, 8, and 11 and split back 1:8 on days 4, 7, and 10. Images were taken on day 11. Numbers in the bottom right corner represent the percentage of TUNEL+ cells in separate KD experiments. (E) Western blots for Smc2, Mcm, Ints1, and actin in iMEFs depleted of the indicated proteins at various points during the time course. “d” indicates length of KD in days. (C and E) The positions of molecular mass standards (in kilodaltons) are shown. (F) Proliferation of iMEFs depleted of the indicated proteins during the time course described in D. KD cells were split and counted at 3-d intervals. One of two independent experiments with comparable results is shown. Bars, 120 µm.
Figure 2.
Figure 2.
ES cells depleted of regulators of essential processes accumulate DNA damage but exhibit distinct cell cycle phenotypes. (A, left) Western blots for p53, γ-H2AX, and actin in ES cells (ESCs) and primary MEFs depleted of the indicated proteins. (right) p53 protein levels with (+) or without (−) UV exposure. For all blots, actin levels are shown as a loading control. Asterisks denote background bands of unknown identity. (B) Western blots for p53, p53 phosphorylated on serine 15, p53 phosphorylated on serine 20, p21, and actin in ES cells and primary MEFs depleted of the indicated proteins. (A and B) The positions of molecular mass standards (in kilodaltons) are shown. (C) Cell cycle profiles of ES cells knocked down for the proteins indicated. Cell number is plotted on the vertical axis, and DNA content is plotted on the horizontal axis. The arrowhead denotes a small 8N population observed in Smc2 KD ES cells, and the dashed lines center on the 2N and 4N peaks in control cells. The percentages of cells in each phase of the cell cycle or exhibiting tetraploidy (8N) are shown to the right.
Figure 3.
Figure 3.
Condensins I and II are redundantly required for ES cell proliferation. (A) Morphology of ES cell colonies depleted of NcapD2, NcapD3, both NcapD2 and -D3, or Smc2. (B) Proportion of apoptotic (TUNEL+) ES cells depleted of condensin complexes as in A. (C) Proportion of apoptotic (TUNEL+) E14 ES cells or iMEFs upon mitotic arrest by nocodazole (noc) treatment. (B and C) Means and standard deviations of triplicate samples are shown. Bars, 120 µm.
Figure 4.
Figure 4.
Condensin-depleted ES cells arrest at metaphase and accumulate large, misshapen interphase nuclei. (A) Fractions of mitotic cells in each stage of mitosis in mock- or Smc2-depleted ES cells. Live cells expressing H2A-GFP were counted and scored for each phase of mitosis. Means and standard deviations of triplicate samples are shown. (B) Representative time-lapse live cell imaging of mock- or Smc2-depleted H2A-GFP ES cells starting in metaphase and imaged at the times (in minutes) indicated in each box. ES cells grow in clusters and rotate within the cluster, resulting in different views of the metaphase plate during the time lapse. (C) Fields of H2A-GFP–expressing ES cells either mock or Smc2 depleted for 4 d. White arrowheads denote multipolar mitoses. (D) ES cells either mock or Smc2 depleted for 4 d were fixed, cytospun onto slides, and DAPI stained, and 1-µm z sections were captured. Deconvolved z sections at the midpoint of each stack are shown. (E) Box plot of the nuclear volumes (nuc. vol.) in thousands of femtoliters (fL × 103) of 10–20 ES cell nuclei for each KD indicated. The top and bottom edges of each box represent the 75th and 25th percentiles, respectively, whereas the bold line represents the median of each group. The asterisk indicates a statistically significant difference between the nuclear volumes of mock and Smc2 KD cells (P < 2 × 10⁻⁵; Student’s t test). Bars: (B) 2.5 µm; (C) 30 µm; (D) 10 µm.
Figure 5.
Figure 5.
Condensin KD results in interphase chromatin decondensation. (A) DNA-FISH for Mecp2 and Pgk1 in control (mock) or condensin KD (Smc2 and Smc4 KD) E14 ES cells. The merged panel (right) consists of Mecp2 (red), Pgk1 (green), and DAPI (blue). (B) Area occupied by Mecp2, Pgk1, Fn1, or OR2-1 loci in control and condensin KD ES cells, as measured by FISH. The maximum area occupied by each of the four loci was plotted against nuclear diameter for 10–20 cells per locus for control (mock) and condensin KD E14 ES cells. Bars, 5 µm.
Figure 6.
Figure 6.
Alterations in chromatin modifications in condensin KD ES cells. (A) H3K9me3 localization in control (mock KD) and condensin KD (Smc2 KD) E14 ES cells, as shown by immunofluorescence. The arrowhead indicates a cell with large pericentric heterochromatin H3K9me3 foci. (B) Quantification of control and condensin KD E14 (WT) and p53−/− ES cells with large foci of H3K9me3 staining. Means and standard deviations of three replicate experiments are shown. (C) 5meC in control (mock KD) and condensin KD (Smc2 KD) E14 ES cells. The arrowhead indicates a cell with large 5meC foci. (D) Quantification of 5meC staining, as in B. (E) H3S10P localization in control and condensin KD E14 ES cells. The green arrowhead indicates a cell with diffuse or weak H3S10P interphase staining. The red arrowhead indicates an interphase cell with small H3S10P foci (a pattern similar to that is transiently seen when somatic cells are serum stimulated). The blue arrowhead indicates an interphase cell with large H3S10P foci at pericentric heterochromatin. (F) Percentage of E14 (WT) and p53−/− ES cells in each category indicated on the right. Bars, 5 µm.

Similar articles

Cited by

References

    1. Aladjem M.I., Spike B.T., Rodewald L.W., Hope T.J., Klemm M., Jaenisch R., Wahl G.M. 1998. ES cells do not activate p53-dependent stress responses and undergo p53-independent apoptosis in response to DNA damage. Curr. Biol. 8:145–155 10.1016/S0960-9822(98)70061-2 - DOI - PubMed
    1. Baillat D., Hakimi M.A., Näär A.M., Shilatifard A., Cooch N., Shiekhattar R. 2005. Integrator, a multiprotein mediator of small nuclear RNA processing, associates with the C-terminal repeat of RNA polymerase II. Cell. 123:265–276 10.1016/j.cell.2005.08.019 - DOI - PubMed
    1. Banáth J.P., Bañuelos C.A., Klokov D., MacPhail S.M., Lansdorp P.M., Olive P.L. 2009. Explanation for excessive DNA single-strand breaks and endogenous repair foci in pluripotent mouse embryonic stem cells. Exp. Cell Res. 315:1505–1520 10.1016/j.yexcr.2008.12.007 - DOI - PubMed
    1. Belmont A.S. 2006. Mitotic chromosome structure and condensation. Curr. Opin. Cell Biol. 18:632–638 10.1016/j.ceb.2006.09.007 - DOI - PubMed
    1. Benanti J.A., Williams D.K., Robinson K.L., Ozer H.L., Galloway D.A. 2002. Induction of extracellular matrix-remodeling genes by the senescence-associated protein APA-1. Mol. Cell. Biol. 22:7385–7397 10.1128/MCB.22.21.7385-7397.2002 - DOI - PMC - PubMed

Publication types

MeSH terms