Decadal trends in marine reserves reveal differential rates of change in direct and indirect effects
- PMID: 20176941
- PMCID: PMC2972978
- DOI: 10.1073/pnas.0908012107
Decadal trends in marine reserves reveal differential rates of change in direct and indirect effects
Abstract
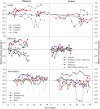
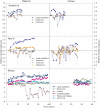
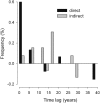
Decadal-scale observations of marine reserves suggest that indirect effects on taxa that occur through cascading trophic interactions take longer to develop than direct effects on target species. Combining and analyzing a unique set of long-term time series of ecologic data in and out of fisheries closures from disparate regions, we found that the time to initial detection of direct effects on target species (±SE) was 5.13 ± 1.9 years, whereas initial detection of indirect effects on other taxa, which were often trait mediated, took significantly longer (13.1 ± 2.0 years). Most target species showed initial direct effects, but their trajectories over time were highly variable. Many target species continued to increase, some leveled off, and others decreased. Decreases were due to natural fluctuations, fishing impacts from outside reserves, or indirect effects from target species at higher trophic levels. The average duration of stable periods for direct effects was 6.2 ± 1.2 years, even in studies of more than 15 years. For indirect effects, stable periods averaged 9.1 ± 1.6 years, although this was not significantly different from direct effects. Populations of directly targeted species were more stable in reserves than in fished areas, suggesting increased ecologic resilience. This is an important benefit of marine reserves with respect to their function as a tool for conservation and restoration.
Conflict of interest statement
The authors declare no conflict of interest.
Figures


References
-
- Cinner JE, et al. Linking social and ecological systems to sustain coral reef fisheries. Curr Biol. 2009;19:206–212. - PubMed
-
- Steneck RS, et al. Thinking and managing outside the box: Coalescing connectivity networks to build region-wide resilience in coral reef ecosystems. Coral Reefs. 2009;28:367–368.
-
- Denny CM, Willis TJ, Babcock RC. Rapid recolonisation of snapper Pagrus auratus: Sparidae within an offshore island marine reserve after implementation of no-take status. Mar Ecol Prog Ser. 2004;272:183–190.
-
- McClanahan TR. Recovery of a coral reef keystone predator, Balistapus undulatus, in East African marine parks. Biol Conserv. 2000;94:191–198.
MeSH terms
LinkOut - more resources
Full Text Sources
Other Literature Sources

