

Adaptive management of the Great Barrier Reef: a globally significant demonstration of the benefits of networks of marine reserves
- PMID: 20176947
- PMCID: PMC2972947
- DOI: 10.1073/pnas.0909335107
Adaptive management of the Great Barrier Reef: a globally significant demonstration of the benefits of networks of marine reserves
Abstract
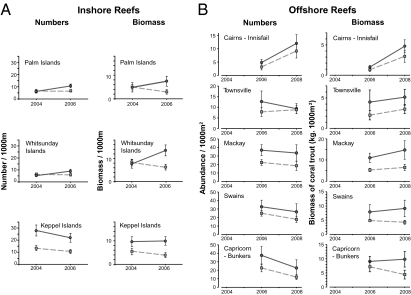
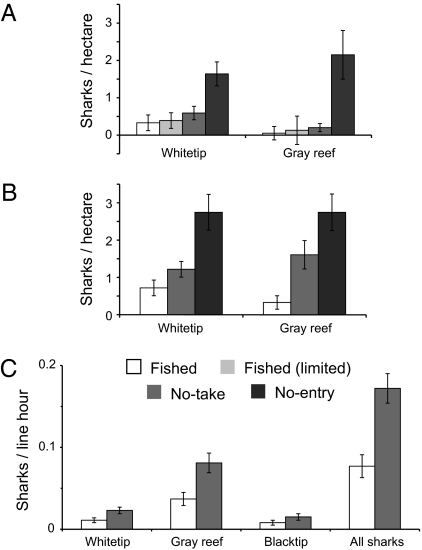
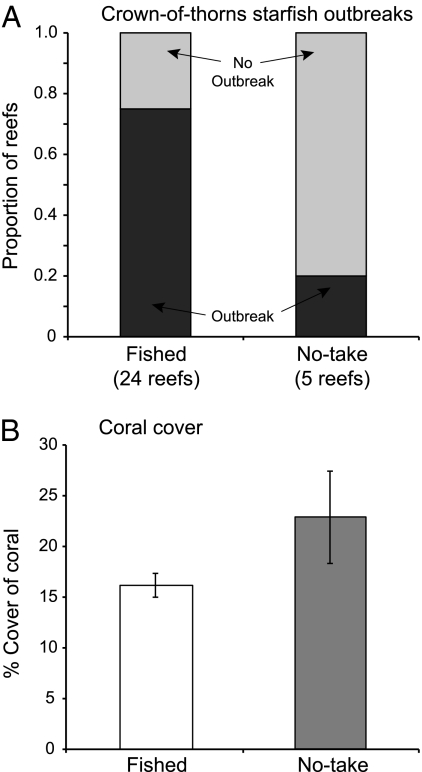
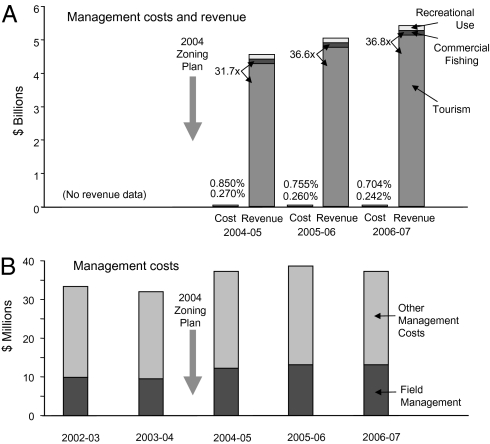
The Great Barrier Reef (GBR) provides a globally significant demonstration of the effectiveness of large-scale networks of marine reserves in contributing to integrated, adaptive management. Comprehensive review of available evidence shows major, rapid benefits of no-take areas for targeted fish and sharks, in both reef and nonreef habitats, with potential benefits for fisheries as well as biodiversity conservation. Large, mobile species like sharks benefit less than smaller, site-attached fish. Critically, reserves also appear to benefit overall ecosystem health and resilience: outbreaks of coral-eating, crown-of-thorns starfish appear less frequent on no-take reefs, which consequently have higher abundance of coral, the very foundation of reef ecosystems. Effective marine reserves require regular review of compliance: fish abundances in no-entry zones suggest that even no-take zones may be significantly depleted due to poaching. Spatial analyses comparing zoning with seabed biodiversity or dugong distributions illustrate significant benefits from application of best-practice conservation principles in data-poor situations. Increases in the marine reserve network in 2004 affected fishers, but preliminary economic analysis suggests considerable net benefits, in terms of protecting environmental and tourism values. Relative to the revenue generated by reef tourism, current expenditure on protection is minor. Recent implementation of an Outlook Report provides regular, formal review of environmental condition and management and links to policy responses, key aspects of adaptive management. Given the major threat posed by climate change, the expanded network of marine reserves provides a critical and cost-effective contribution to enhancing the resilience of the Great Barrier Reef.
Conflict of interest statement
The authors declare no conflict of interest.
Figures
References
-
- Roberts CM, et al. Marine biodiversity hotspots and conservation priorities for tropical reefs. Science. 2002;295:1280–1284. - PubMed
-
- Pitcher CR, et al. Seabed Biodiversity on the Continental Shelf of the Great Barrier Reef World Heritage Area: CRC Reef Research Task Final Report. Cleveland, QLD: CSIRO Marine and Atmospheric Research; 2007.
-
- Hughes TP, et al. Climate change, human impacts, and the resilience of coral reefs. Science. 2003;301:929–933. - PubMed
-
- Hoegh-Guldberg O, et al. Coral reefs under rapid climate change and ocean acidification. Science. 2007;318:1737–1742. - PubMed
-
- Wilkinson C. Status of Coral Reefs of the World: 2008. Townsville: Global Coral Reef Monitoring Network and Reef and Rainforest Research Centre; 2008.
Publication types
MeSH terms
LinkOut - more resources
Full Text Sources
Miscellaneous
