. 2010 Mar 9;107(10):4544-9.
doi: 10.1073/pnas.0914023107. Epub 2010 Feb 22.

Specificity landscapes of DNA binding molecules elucidate biological function

Affiliations

Specificity landscapes of DNA binding molecules elucidate biological function

Clayton D Carlson et al. Proc Natl Acad Sci U S A. .

Abstract

Evaluating the specificity spectra of DNA binding molecules is a nontrivial challenge that hinders the ability to decipher gene regulatory networks or engineer molecules that act on genomes. Here we compare the DNA sequence specificities for different classes of proteins and engineered DNA binding molecules across the entire sequence space. These high-content data are visualized and interpreted using an interactive "specificity landscape" which simultaneously displays the affinity and specificity of a million-plus DNA sequences. Contrary to expectation, specificity landscapes reveal that synthetic DNA ligands match, and often surpass, the specificities of eukaryotic DNA binding proteins. The landscapes also identify differential specificity constraints imposed by diverse structural folds of natural and synthetic DNA binders. Importantly, the sequence context of a binding site significantly influences binding energetics, and utilizing the full contextual information permits greater accuracy in annotating regulatory elements within a given genome. Assigning such context-dependent binding values to every DNA sequence across the genome yields predictive genome-wide binding landscapes (genomescapes). A genomescape of a synthetic DNA binding molecule provided insight into its differential regulatory activity in cultured cells. The approach we describe will accelerate the creation of precision-tailored DNA therapeutics and uncover principles that govern sequence-specificity of DNA binding molecules.


Conflict of interest statement

The authors declare a conflict of interest. A.Z.A. is a founder/proprietor and C.L.W. and M.S.O. are part-time employees of VistaMotif, and M.S.O. owns Invitrogen stock.

Figures

Fig. 1.
Fig. 1.
CSI binding motifs for engineered and natural DNA-binding molecules. (A) Each feature on the array displays a unique sequence as a DNA hairpin, with all permutations of 10 bp DNA represented on the array (∼1 million sequences). A protein or small molecule is applied to the microarray to obtain a comprehensive ligand-binding profile. The resulting binding profile yields a histogram of many weak binding features (Gray-Blue), some moderate binding features (Green-Yellow), and a few strong binding features (Red). PWMs are generated from the highest intensity data and displayed as a Logo. (B) The Upper displays CSI-determined PWMs for a hairpin polyamide (PA-1) and C2H2 zinc finger. The pie chart represents the distribution of DNA-binding folds across all TFs in the human genome. The Lower displays CSI-determined PWMs for six major classes of DNA-binding folds. PDB codes are listed in supplementary material. For polyamides, filled circle = N-methyl imidazole;open circle = N-methyl pyrrole; open circle with inner dot = pyrrole with attached Cy5 dye; turn = γ-aminobutyric acid; diamond = β-alanine; half-circle with a positive charge = dimethylaminopripylamide; and R = Cy5 dye.
Fig. 2.
Fig. 2.
Sequence-Specificity Landscapes present comprehensive DNA binding data. (A) The complete distribution (Upper Left) of intensities from the CSI analysis are shown for Nkx-2.5. Whereas PWMs only utilize the best binding sequences (Red portion of the histogram), SSLs represent every sequence assayed (Gray-Red) in either a circular (right) or linear (bottom) format. Circular SSLs display the binding intensities of a given DNA ligand across all DNA permutations on the CSI array, with every sequence displayed on the plot. We note the number of mismatches from the seed motif on each concentric circle. For these specificity landscapes, the seed motif TTAAGTG is used. The dashed purple line indicates the start of sequences bearing a mismatch in the first position. For linear SSLs (Right and Fig. S2), each row corresponds to a ring in the circular display. Unlike the circular SSL, sequences bearing multiple mismatches from the motif are plotted multiple times to maintain the vertical alignment between panels in the linear SSL. (B) The SSLs of the engineered DNA-binding molecules (Left) are compared to the SSLs for TFs representing a diverse set of DNA binding folds (Right). The optimized composite SSL for the Nkx-2.5 submotifs is shown rather than the single motif TTAAGTG in Fig. 2A. The chemical structure and Logo of PA-2 is shown in Fig. S1B.
Fig. 3.
Fig. 3.
Specificity landscapes of polyamide structures with diverse composition and architecture. (A) (Upper) Schematics of three additional polyamides examined on the CSI microarray. A key displaying the structure of each ring symbol is shown on the bottom and the conjugated Cy3 or Cy5 dyes are displayed as green or red circles respectively. (Center) Logos generated from PWMs of the highest intensity sequences on the CSI microarray. (Bottom) SSL for each of the polyamides, using a single motif. (B) Optimized SSL for PA-5. Multiple submotifs optimally partition the sequences to yield an even distribution of high-affinity sites in the center circle.
Fig. 4.
Fig. 4.
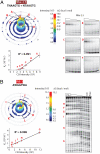
Sequence-Specificity Landscapes as Energy Landscapes. (A) Six sequences of different intensities were identified (labeled A–F), and their binding was measured in solution by EMSA. The color scale (Center) shows the relationship of SSL-CSI intensities to their corresponding ΔG values (ΔG = -RT ln KA). The linear correlation plot between KA and CSI intensity is shown on the bottom. This correlation allows the binding affinity for all sequences to be determined using the corresponding CSI intensity. (B) Nuclease protection for six sequences (labeled G–L) from the CSI microarray refined from (29) for PA-1. The linear correlation plot between KA and CSI intensity is shown on the bottom. Each point represents the average of three measurements and error bars indicate one standard deviation. The concentration of Nkx-2.5 ranged from 2μM to 3nM (in twofold increments) and for PA-1 they ranged from 300nM to 0.5nM (in threefold increments).
Fig. 5.
Fig. 5.
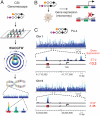
Genomescapes of CSI microarray data. (A) Genomescapes are generated by assigning an intensity to every 10 bp sequence in the genome from the CSI data. (B) RNA microarray expression levels from untreated cells and cells incubated with PA-4 were compared to determine the degree of inhibition induced by the polyamide (18). (C) The genomescape for PA-4 data was obtained from CSI analysis and the top of each subpanel displays 100 Mbp of the chromosome surrounding either the VEGF or ET-2 gene. The expanded regions show two 100 bp regions containing the HRE binding site and TSS for each gene. The highest extent of inhibition is found at the ET-2 gene by PA-4 which binds at both the activating HRE and several points along the TSS.

References

    1. Darnell JE., Jr Transcription factors as targets for cancer therapy. Nat Rev Cancer. 2002;2:740–749. - PubMed
    1. Gottesfeld JM, Turner JM, Dervan PB. Chemical approaches to control gene expression. Gene Expression. 2000;9(1-2):77–91. - PMC - PubMed
    1. Hauschild KE, Carlson CD, Donato LJ, Moretti R, Ansari AZ. Transcription Factors. In: Begley T, editor. Wiley Encyclopedia of Chemical Biology. Vol. 4. New York: John Wiley & Sons, Inc; 2008. pp. 566–584.
    1. Ptashne M, Gann A. Genes & Signals. New York: Cold Springs Harbor Laboratory Press; 2002.
    1. Choo Y, Klug A. Toward a code for the interactions of zinc fingers with DNA: Selection of randomized fingers displayed on phage. Proc Natl Acad Sci USA. 1994;91:11163–11167. - PMC - PubMed

Publication types

MeSH terms

LinkOut - more resources