

Risk factors for prostate cancer detection after a negative biopsy: a novel multivariable longitudinal approach
- PMID: 20177031
- PMCID: PMC2849765
- DOI: 10.1200/JCO.2008.20.3422
Risk factors for prostate cancer detection after a negative biopsy: a novel multivariable longitudinal approach
Abstract
Purpose: To introduce a novel approach for the time-dependent quantification of risk factors for prostate cancer (PCa) detection after an initial negative biopsy.
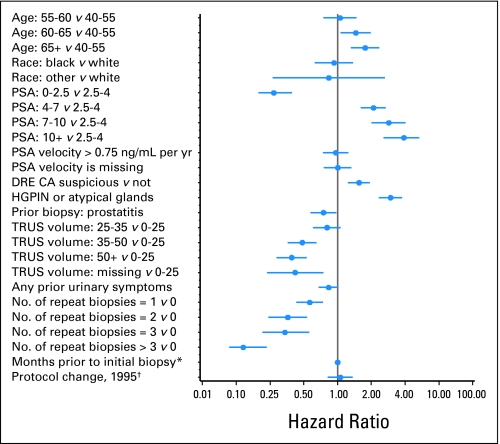
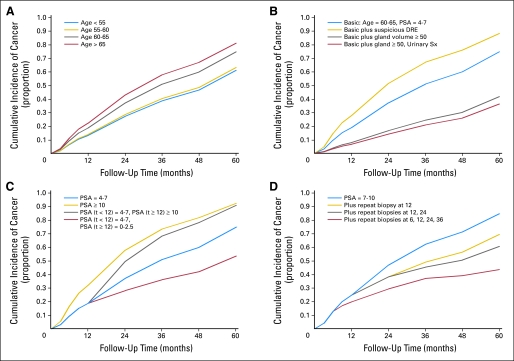
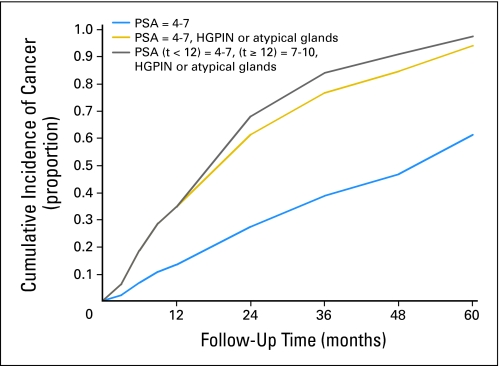
Patients and methods: Data for 1,871 men with initial negative biopsies and at least one follow-up biopsy were available. Piecewise exponential regression models were developed to quantify hazard ratios (HRs) and define cumulative incidence curves for PCa detection for subgroups with specific patterns of risk factors over time. Factors evaluated included age, race, serum prostate-specific antigen (PSA) concentration, PSA slope, digital rectal examination, dysplastic glands or prostatitis on biopsy, ultrasound gland volume, urinary symptoms, and number of negative biopsies.
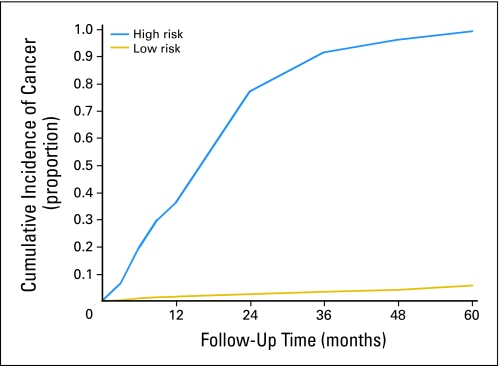
Results: Four hundred sixty-five men had PCa detected, after a mean follow-up time of 2.8 years. All of the factors were independent predictors of PCa detection except for PSA slope, as a result of its correlation with time-dependent PSA level, and race. PSA (HR = 3.90 for > 10 v 2.5 to 3.9 ng/mL), high-grade prostatic intraepithelial neoplasia/atypical glands (HR = 2.97), gland volume (HR = 0.39 for > 50 v < 25 mL), and number of repeat biopsies (HR = 0.36 for two v zero repeat biopsies) were the strongest predictors. Men with high-risk versus low-risk event histories had a 20-fold difference in PCa detection over 5 years.
Conclusion: Piecewise exponential models provide an approach to longitudinal analysis of PCa risk that allows clinicians to see the interplay of risk factors as they unfold over time for individual patients. With these models, it is possible to identify distinct subpopulations with dramatically different needs for monitoring and repeat biopsy.
Conflict of interest statement
Authors' disclosures of potential conflicts of interest and author contributions are found at the end of this article.
Figures
References
-
- Fleshner NE, O'Sullivan M, Fair WR. Prevalence and predictors of a positive repeat transrectal ultrasound guided needle biopsy of the prostate. J Urol. 1997;158:505–508. - PubMed
-
- Catalona WJ, Beiser JA, Smith DS. Serum free prostate specific antigen and prostate specific antigen density measurements for predicting cancer in men with prior negative prostatic biopsies. J Urol. 1997;158:2162–2167. - PubMed
-
- Chun FK, Briganti A, Graefen M, et al. Development and external validation of an extended repeat biopsy nomogram. J Urol. 2007;177:510–515. - PubMed
-
- Djavan B, Zlotta A, Remzi M, et al. Optimal predictors of prostate cancer on repeat prostate biopsy: A prospective study of 1,051 men. J Urol. 2000;163:1144–1148. - PubMed
-
- Fowler JE, Jr, Bigler SA, Miles D, et al. Predictors of first repeat biopsy cancer detection with suspected local stage prostate cancer. J Urol. 2000;163:813–818. - PubMed
Publication types
MeSH terms
Grants and funding
LinkOut - more resources
Full Text Sources
Other Literature Sources
Medical
Research Materials
Miscellaneous
