Deletion of Puma protects hematopoietic stem cells and confers long-term survival in response to high-dose gamma-irradiation
- PMID: 20177048
- PMCID: PMC2867261
- DOI: 10.1182/blood-2009-10-248278
Deletion of Puma protects hematopoietic stem cells and confers long-term survival in response to high-dose gamma-irradiation
Abstract
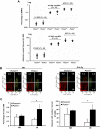
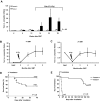
Molecular paradigms underlying the death of hematopoietic stem cells (HSCs) induced by ionizing radiation are poorly defined. We have examined the role of Puma (p53 up-regulated mediator of apoptosis) in apoptosis of HSCs after radiation injury. In the absence of Puma, HSCs were highly resistant to gamma-radiation in a cell autonomous manner. As a result, Puma-null mice or the wild-type mice reconstituted with Puma-null bone marrow cells were strikingly able to survive for a long term after high-dose gamma-radiation that normally would pose 100% lethality on wild-type animals. Interestingly, there was no increase of malignancy in the exposed animals. Such profound beneficial effects of Puma deficiency were likely associated with better maintained quiescence and more efficient DNA repair in the stem cells. This study demonstrates that Puma is a unique mediator in radiation-induced death of HSCs. Puma may be a potential target for developing an effective treatment aimed to protect HSCs from lethal radiation.
Figures


Similar articles
-
Deletion of proapoptotic Puma selectively protects hematopoietic stem and progenitor cells against high-dose radiation.Blood. 2010 Jun 10;115(23):4707-14. doi: 10.1182/blood-2009-10-248872. Epub 2010 Apr 1. Blood. 2010. PMID: 20360471 Free PMC article.
-
Deletion of Irf5 protects hematopoietic stem cells from DNA damage-induced apoptosis and suppresses γ-irradiation-induced thymic lymphomagenesis.Oncogene. 2014 Jun 19;33(25):3288-97. doi: 10.1038/onc.2013.295. Epub 2013 Aug 5. Oncogene. 2014. PMID: 23912454
-
Interleukin-33 regulates hematopoietic stem cell regeneration after radiation injury.Stem Cell Res Ther. 2019 Apr 18;10(1):123. doi: 10.1186/s13287-019-1221-1. Stem Cell Res Ther. 2019. PMID: 30999922 Free PMC article.
-
Hematopoietic stem cell injury induced by ionizing radiation.Antioxid Redox Signal. 2014 Mar 20;20(9):1447-62. doi: 10.1089/ars.2013.5635. Epub 2014 Feb 10. Antioxid Redox Signal. 2014. PMID: 24124731 Free PMC article. Review.
-
Regulation of hematopoietic stem cell integrity through p53 and its related factors.Ann N Y Acad Sci. 2016 Apr;1370(1):45-54. doi: 10.1111/nyas.12986. Epub 2015 Dec 22. Ann N Y Acad Sci. 2016. PMID: 26695737 Review.
Cited by
-
Antagonism between MCL-1 and PUMA governs stem/progenitor cell survival during hematopoietic recovery from stress.Blood. 2015 May 21;125(21):3273-80. doi: 10.1182/blood-2015-01-621250. Epub 2015 Apr 6. Blood. 2015. PMID: 25847014 Free PMC article.
-
Genetically defining the mechanism of Puma- and Bim-induced apoptosis.Cell Death Differ. 2012 Apr;19(4):642-9. doi: 10.1038/cdd.2011.136. Epub 2011 Oct 21. Cell Death Differ. 2012. PMID: 22015606 Free PMC article.
-
Evaluation of the BH3-only protein Puma as a direct Bak activator.J Biol Chem. 2014 Jan 3;289(1):89-99. doi: 10.1074/jbc.M113.505701. Epub 2013 Nov 21. J Biol Chem. 2014. PMID: 24265320 Free PMC article.
-
Targeting p53-dependent stem cell loss for intestinal chemoprotection.Sci Transl Med. 2018 Feb 7;10(427):eaam7610. doi: 10.1126/scitranslmed.aam7610. Sci Transl Med. 2018. PMID: 29437148 Free PMC article.
-
Low doses of oxygen ion irradiation cause long-term damage to bone marrow hematopoietic progenitor and stem cells in mice.PLoS One. 2017 Dec 12;12(12):e0189466. doi: 10.1371/journal.pone.0189466. eCollection 2017. PLoS One. 2017. PMID: 29232383 Free PMC article.
References
-
- Mauch P, Constine L, Greenberger J, et al. Hematopoietic stem cell compartment: acute and late effects of radiation therapy and chemotherapy. Int J Radiat Oncol Biol Phys. 1995;31(5):1319–1339. - PubMed
-
- Carr AM. Cell cycle: piecing together the p53 puzzle. Science. 2000;287(5459):1765–1766. - PubMed
-
- Komarov PG, Komarova EA, Kondratov RV, et al. A chemical inhibitor of p53 that protects mice from the side effects of cancer therapy. Science. 1999;285(5434):1733–1737. - PubMed
-
- Westphal CH, Rowan S, Schmaltz C, Elson A, Fisher DE, Leder P. atm and p53 cooperate in apoptosis and suppression of tumorigenesis, but not in resistance to acute radiation toxicity. Nat Genet. 1997;16(4):397–401. - PubMed
MeSH terms
Substances
Grants and funding
LinkOut - more resources
Full Text Sources
Medical
Research Materials
Miscellaneous

