. 2010 Apr 23;285(17):13079-91.
doi: 10.1074/jbc.M109.044206. Epub 2010 Feb 22.

Poly(ADP-ribose) polymerase (PARP)-1-independent apoptosis-inducing factor (AIF) release and cell death are induced by eleostearic acid and blocked by alpha-tocopherol and MEK inhibition

Affiliations

Poly(ADP-ribose) polymerase (PARP)-1-independent apoptosis-inducing factor (AIF) release and cell death are induced by eleostearic acid and blocked by alpha-tocopherol and MEK inhibition

Kazunari Kondo et al. J Biol Chem. .

Abstract

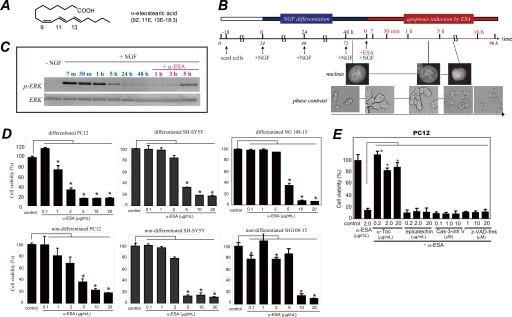
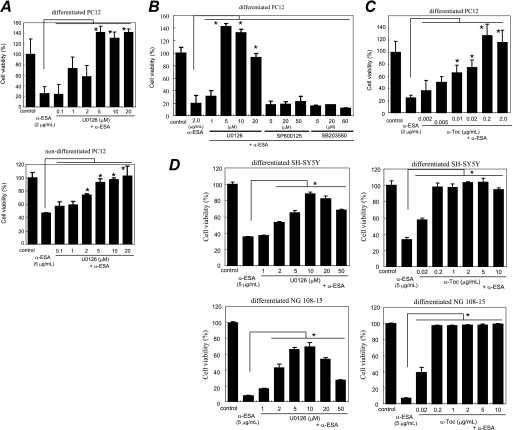
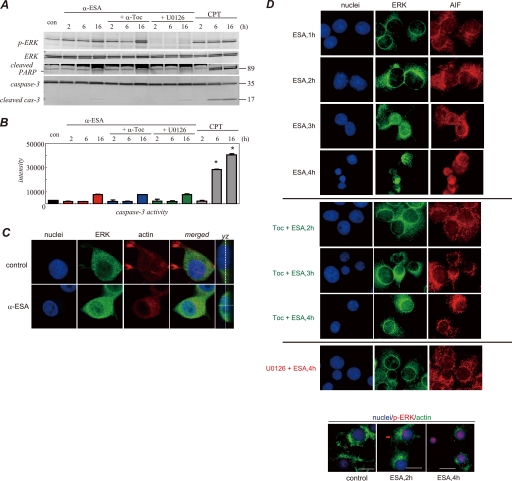
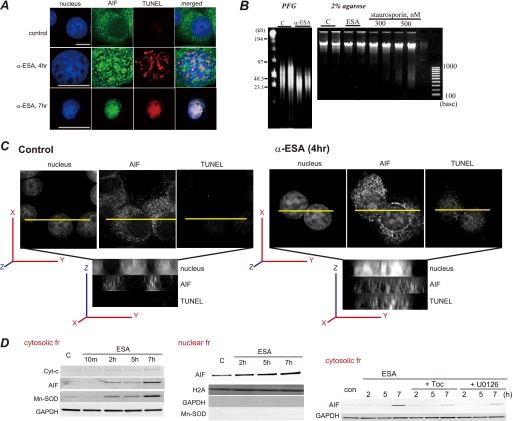
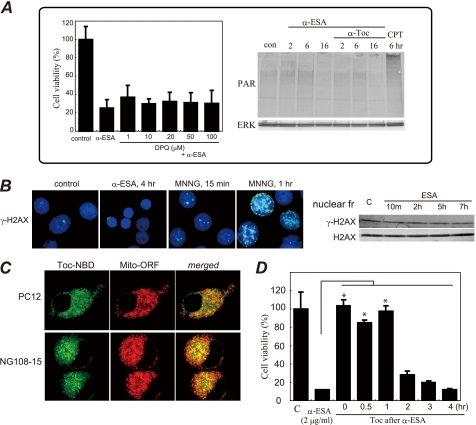
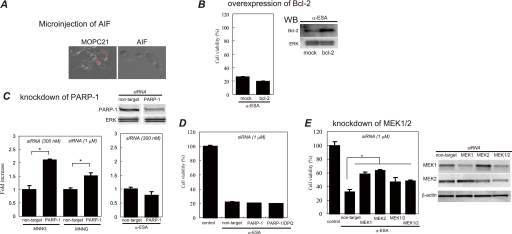
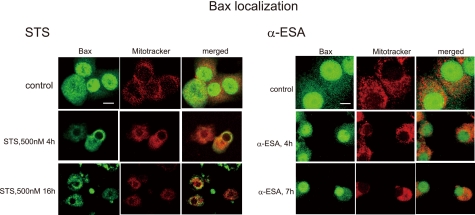
Poly(ADP-ribose)polymerase-1 (PARP-1) is thought to be required for apoptosis-inducing factor (AIF) release from mitochondria in caspase-independent apoptosis. The mechanism by which AIF is released through PARP-1 remains unclear. Here, we provide evidence that PARP-1-independent AIF release and cell death are induced by a trienoic fatty acid, alpha-eleostearic acid (alpha-ESA). Alpha-ESA induced the caspase-independent and AIF-initiated apoptotic death of neuronal cell lines, independently of PARP-1 activation. The cell death was inhibited by the MEK inhibitor U0126 and by knockdown of MEK using small interfering RNA. However, inhibitors for JNK, p38 inhibitors, calpain, phospholipase A(2), and phosphatidylinositol 3-kinase, did not block cell death. AIF was translocated to the nucleus after the induction of apoptosis by alpha-ESA in differentiated PC12 cells without activating caspase-3 and PARP-1. The alpha-ESA-mediated cell death was not inhibited by PARP inhibitor 3,4-dihydro-5-[4-(1-piperidinyl)butoxyl]-1(2H)-isoquinoline and by knockdown of PARP-1 using small interfering RNA. Unlike N-methyl-N'-nitro-N-nitrosoguanidine treatment, histone-phosphorylated histone 2AX was not phosphorylated by alpha-ESA, which suggests no DNA damage. Overexpression of Bcl-2 did not inhibit the cell death. alpha-ESA caused a small quantity of superoxide production in the mitochondria, resulting in the reduction of mitochondrial membrane potential, both of which were blocked by a trace amount of alpha-tocopherol localized in the mitochondria. Our results demonstrate that alpha-ESA induces PARP-1-independent AIF release and cell death without activating Bax, cytochrome c, and caspase-3. MEK is also a key molecule, although the link between ERK, AIF release, and cell death remains unknown. Finding molecules that regulate AIF release may be an important therapeutic target for the treatment of neuronal injury.


Figures

FIGURE 1.
FIGURE 1.
α-ESA induces apoptotic cell death in neuronal cells. A, structure of α-ESA. B, time course of α-ESA-mediated cell death in the differentiated PC12 cells. The cells were differentiated by NGF for 48 h and then exposed to α-ESA. C, time course of phosphorylation of ERK1/2 during NGF and α-ESA treatment. NGF induced a strong phosphorylation of ERK1/2, and its phosphorylation decreased to the basal level by 48 h. Then the addition of α-ESA induced prolonged and moderate phosphorylation of ERK1/2 again, resulting in the cell death. D, α-ESA (2 μg/ml) induced apoptotic cell death in neuronal PC12, SH-SY5Y, and NG108-15 cells. n = 9; p < 0.05 versus control (DMSO alone). E, α-ESA-mediated apoptosis was not inhibited by pan-caspase inhibitor Z-VAD-fmk and caspase-3 inhibitor in PC12 cells. α-Toc, but not epicatechin, inhibited the cell death. The values represent the means ± S.D. The viability of α-ESA treated cells was measured by WST-8 reagent 16 h after the treatment. *, p < 0.05.
FIGURE 2.
FIGURE 2.
MEK inhibitor and α-tocopherol block α-ESA-mediated cell death. A, MEK inhibitor U0126 prevented α-ESA-mediated cell death in both differentiated and nondifferentiated PC12 cells (5 or 2 μm). n = 6; *, p < 0.05 versus α-ESA alone. B, JNK inhibitor SP600125 and p38 inhibitor SB203580 did not block α-ESA-mediated cell death. C, α-Toc blocked α-ESA-mediated cell death at lower concentrations (0.01 μg/ml). n = 6; *, p < 0.05 versus α-ESA alone. D, in both SH-SY5Y and NG108-15 cells, α-ESA-mediated cell death was blocked by U0126 and α-Toc. The values represent the means ± S.D. The viability of α-ESA treated cells was measured by WST-8 16 h after the treatment.
FIGURE 3.
FIGURE 3.
ERK1/2 phosphorylation, PARP-1, and caspase-3 activation induced by α-ESA. A, Western blot samples were prepared from PC12 cells at different time points (2, 6, and 16 h). Western blot analysis was independently repeated three times, and representative data are shown here. ERK1/2 was phosphorylated 2 h or later after α-ESA treatment. U0126 blocked the phosphorylation, whereas α-Toc did not. The cleaved form of PARP-1 (89 kDa) and the active form of caspase-3 (17 kDa) were not detected in α-ESA-treated cells. con, control. B, caspase-3 enzymatic activity was measured using a fluorescent substrate. The activity remained at the basal level until 6 h after the induction of apoptosis by α-ESA. CPT was used as a positive control of caspase-3 activity. *, p < 0.05 versus control (DMSO alone). C, ERK1/2 migrated to the nucleus upon α-ESA treatment. Images were obtained from samples treated with α-ESA for 4–5 h. Growth cone disappeared, and the actin rearrangements were suppressed. The confocal microscopy images showed that ERK1/2 was localized throughout the nucleus. D, treatment of U0126, but not α-Toc, blocked nuclear localization of ERK1/2. The nuclear localization of ERK1/2 and AIF was observed in the α-ESA-mediated cells. Phosphorylated ERK1/2 was observed in the nucleus (bottom panel).
FIGURE 4.
FIGURE 4.
AIF translocation to the nucleus by α-ESA. A, α-ESA induced AIF translocation from the mitochondria to the nucleus. At 4 h after the induction of apoptosis by α-ESA, AIF was translocated to the nucleus (green). The nucleus was stained with TUNEL (red) and Hoechst (blue). Scale bars show 10 μm. The TUNEL staining was scattered. By 7 h, the nucleus greatly condensed, and AIF spread throughout the nucleus. The peripheral distribution of chromatin in the α-ESA-treated cell shown was characteristic of AIF-induced stage-I condensation. Images were obtained using the deconvolution microscope. B, DNA analysis. Genomic DNA was extracted from PC12 cells that were treated with either DMSO as a control or α-ESA (2 μg/ml) for 30 h. The extracted DNA was analyzed by pulse field gel (PFG) electrophoresis. High molecular weight fragments (30–50 kb) were detected on pulse field electrophoresis. Nucleosomal DNA fragmentation was analyzed by 2% agarose gel, showing that α-ESA did not induce nucleosomal DNA degradation. C, three-dimensional images of AIF localization in the nucleus. AIF was localized in the whole nucleus, and the nucleus was stained with TUNEL. D, subcellular fractionation analysis. The release of AIF and manganese superoxide dismutase (Mn-SOD) was observed in the cytosolic fraction (fr) of α-ESA-treated cells, resulting in AIF-initiated cell death (left panel). The Western blotting of the nuclear fraction revealed AIF localization in the nucleus. There is no contamination of cytosolic and heavy membrane fractions, including mitochondria. α-Toc and U0126 blocked AIF release to the cytosolic fraction (right panel). GAPDH, glyceraldehyde-3-phosphate dehydrogenase.
FIGURE 5.
FIGURE 5.
A, α-ESA-mediated cell death was not inhibited by the established PARP inhibitor DPQ, and PAR proteins were not detected. CPT (40 μm) was used as a positive control for PAR formation. Data were obtained from two independent experiments performed in triplicate (mean ± S.D.). Significance in DPQ-pretreated cells was not observed (versus α-ESA alone). B, γ-H2AX staining (nuclei in blue and γ-H2AX in green). Phosphorylation (Ser-139) of histone H2AX (γ-H2AX) was induced by MNNG (500 μm), not by α-ESA (2 μg/ml). γ-H2AX protein levels were not changed in α-ESA-mediated cells. c, control. C, α-Toc distribution in PC12 and NG108-15 cells was investigated using a confocal microscope. α-Toc is labeled in green, and mitochondria are labeled in red. The merged images in PC12 and NG108-15 cells show that α-Toc was distributed mostly in the mitochondria. D, effect of α-Toc after α-ESA treatment (post-treatment). α-Toc (0.2 μg/ml) was added to the cells at the same time as or after the addition of α-ESA (2 μg/ml). α-Toc blocked cell death 1 h after the addition of α-ESA. Adding α-Toc more than 2 h after α-ESA had no effect. *, p < 0.05.
FIGURE 6.
FIGURE 6.
Effect of AIF microinjection, Bcl-2 overexpression, and knockdown of PARP-1 and MEK1/2 on α-ESA-mediated apoptosis. A, microinjection of AIF antibody blocks α-ESA-mediated apoptosis. AIF or MOPC21 (isotype control) antibody (Ab) was microinjected into the differentiated PC12 cells using Stamporation apparatus and incubated for 6 h. The cells were exposed to α-ESA (2 μg/ml) for 16 h and stained with propidium iodide. The AIF Ab-microinjected cells blocked α-ESA-mediated cell death, whereas the MOPC21 Ab-microinjected cells did not, stained in red, which means the cells were dead. Images were obtained from three independent experiments. All cells in these images were microinjected. B, bcl-2 was transiently transfected into PC12 cells. After 24 h of incubation, the cells were exposed to α-ESA (2 μg/ml) and incubated for another 16 h. The cell viability was measured for the whole cells. The overexpression of Bcl-2 did not protect PC12 cells from α-ESA-mediated apoptosis (n = 3). WB, Western blot. C, siRNA targeted for rat PARP-1 was transfected into PC12 cells. After 24 h of incubation, the cells were exposed to α-ESA (2 μg/ml) or MNNG (500 μm) and incubated for another 16 h. The cell viability was measured for the whole cells. The knockdown of PARP-1 did not block α-ESA-mediated apoptosis, whereas it prevented MNNG-treated (500 μm, 15 min) cells from the apoptosis. (n = 3; *, p < 0.001). D, combination of PARP-1 knockdown and DPQ treatment (50 μm) had no effect on the block of the apoptosis. E, siRNA experiments for rat MEK1 and MEK2 were performed in the proliferation condition. The knockdown of either MEK1 or MEK2 significantly blocked α-ESA-mediated cell death (n = 6; *, p < 0.05). The knockdown of both MEK1 and MEK2 also inhibited the cell death. The transfection efficiency was ∼80% judging from the cells transfected with cDNA encoding green fluorescent protein. The blots for the knockdown samples are shown in the right panel. The cell viabilities were measured for the whole cells in overexpression and knockdown experiments.
FIGURE 7.
FIGURE 7.
Production of ROS and mitochondrial membrane potential in α-ESA-treated cells. A, intracellular total ROS was measured using H2DCF fluorescent probe. α-ESA initiated ROS, which was blocked by α-Toc (2 μg/ml) but not epicatechin (20 μm). The numbers of ROS-positive cells were counted in the α-ESA-treated cells (12 h) with or without α-Toc. B, production of superoxide anion radicals (O2˙̄) was measured using BESSo fluorescent probe, specific for O2˙̄. Fluorescent intensities were analyzed by ImageJ software. The cell numbers 2 and 3 that have fluorescent intensities more than the signal to noise ratio of >5 were positive. O2˙̄ production was observed 5 h after the addition of α-ESA (bottom right). Membrane blebbing was observed immediately after superoxide production. C, O2˙̄ was measure by MitoSOX Red indicator. O2˙̄ was produced in α-ESA-treated cells. α-Toc (2 μg/ml) inhibited the O2˙̄ production. U0126 (5 μm) almost blocked the O2˙̄ production. D, mitochondrial membrane potential was measured using JC-1. Carbonyl cyanide p-chlorophenylhydrazone (CCCP) (50 μm) immediately shut down the potential. α-ESA gradually reduced the potential. E, mitochondrial morphology during α-ESA-mediated cell death process. Fragmented and condensed mitochondria were observed in the α-ESA-treated cells. Scale bars show 8 μm.
FIGURE 8.
FIGURE 8.
Bax localization of α-ESA-treated cells. The differentiated PC12 cells were treated with staurosporine (1 μm) or α-ESA (2 μg/ml), and stained with anti-Bax and MitoTracker Red CM-H2Ros. Bax migrated into the mitochondria in the STS-treated cells, whereas Bax did not in the α-ESA-treated cells.
FIGURE 9.
FIGURE 9.
A speculative mechanism of α-ESA-mediated cell death. A, staurosporine + Z-VAD-fmk treatment induces Bax/Bak-mediated Cyt-c, AIF, and other apoptotic mitochondrial proteins such Smac/Diablo, although caspase is blocked by Z-VAD-fmk. This type of apoptosis is blocked by pro-survival Bcl-2 protein. B, MNNG, NMDA, or hypoxia ischemia induces the increase in an intracellular Ca2+ concentration ([Ca2+]i), intracellular ROS production, and DNA alkylation followed by PARP-1 activation, which results in PARP-1-mediated AIF release, leading to the caspase-independent cell death. C, α-ESA induces PARP-1-independent AIF-release, resulting in a novel caspase-independent apoptosis. U0126 and MEK1/2 knockdown block the cell death by unknown mechanisms. ERK1/2 is certainly involved in the cell death. α-Toc blocks ROS production in the mitochondria and cell death without the influence on ERK1/2. PARP-1 is not involved in α-ESA-mediated cell death. α-ESA appears to act separately on MEK1/2-ERK1/2 and superoxide production leading to the reduction of the membrane potential.

Similar articles

Cited by

References

    1. Kerr J. F., Wyllie A. H., Currie A. R. (1972) Br. J. Cancer 26, 239–257 - PMC - PubMed
    1. Nagata S. (1997) Cell 88, 355–365 - PubMed
    1. Ashkenazi A., Dixit V. M. (1998) Science 281, 1305–1308 - PubMed
    1. Evan G., Littlewood T. (1998) Science 281, 1317–1322 - PubMed
    1. Taylor R. C., Cullen S. P., Martin S. J. (2008) Nat. Rev. Mol. Cell Biol. 9, 231–241 - PubMed

Publication types

MeSH terms

Substances