. 2010 Apr 23;285(17):13154-69.
doi: 10.1074/jbc.M109.093914. Epub 2010 Feb 21.

Characterization of the biochemical properties and biological function of the formin homology domains of Drosophila DAAM

Affiliations

Characterization of the biochemical properties and biological function of the formin homology domains of Drosophila DAAM

Szilvia Barkó et al. J Biol Chem. .

Abstract

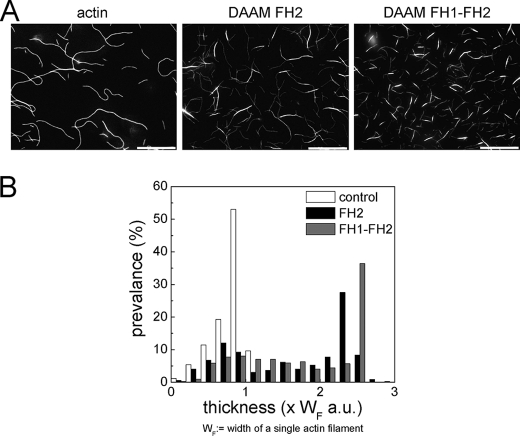
We characterized the properties of Drosophila melanogaster DAAM-FH2 and DAAM-FH1-FH2 fragments and their interactions with actin and profilin by using various biophysical methods and in vivo experiments. The results show that although the DAAM-FH2 fragment does not have any conspicuous effect on actin assembly in vivo, in cells expressing the DAAM-FH1-FH2 fragment, a profilin-dependent increase in the formation of actin structures is observed. The trachea-specific expression of DAAM-FH1-FH2 also induces phenotypic effects, leading to the collapse of the tracheal tube and lethality in the larval stages. In vitro, both DAAM fragments catalyze actin nucleation but severely decrease both the elongation and depolymerization rate of the filaments. Profilin acts as a molecular switch in DAAM function. DAAM-FH1-FH2, remaining bound to barbed ends, drives processive assembly of profilin-actin, whereas DAAM-FH2 forms an abortive complex with barbed ends that does not support profilin-actin assembly. Both DAAM fragments also bind to the sides of the actin filaments and induce actin bundling. These observations show that the D. melanogaster DAAM formin represents an extreme class of barbed end regulators gated by profilin.


Figures

FIGURE 1.
FIGURE 1.
The expression of dDAAM FH2 or FH1-FH2 in Drosophila S2 cells. A–C, S2 cells transfected with YFP::FH2. Note that cells expressing YFP::FH2 (white in A, green in C) are round in shape, such as the non-expressing cells (arrows in B and C). Moreover, both cell types exhibit a similar pattern and level of actin staining (white in B, red in C). D–F, S2 cells transfected with YFP-tagged FH1-FH2 (YFP::FH1-FH2). Note that cells expressing YFP-tagged FH1-FH2 (white in D, green in F) are larger than non-expressing cells (arrows in E and F) and often exhibit a large number of filopodia-like protrusions. Additionally, the F-actin level is highly increased in YFP-tagged FH1-FH2-transfected cells (white in E, red in F). The nucleus is stained with 4′,6-diamidino-2-phenylindole (DAPI) (blue in C and F). G, statistical analyses of the cell shape changes exhibited by S2 cells expressing YFP-tagged FH2 (YFP::FH2), YFP-tagged FH1-FH2, or YFP alone. H, statistical analyses of the cell shape changes exhibited by S2 cells expressing YFP-tagged FH1-FH2 in the absence or presence of profilin (chic) specific dsRNA. Scale bars, 5 μm.
FIGURE 2.
FIGURE 2.
The expression of dDAAM FH2 or FH1-FH2 in the Drosophila tracheal system. A, the cuticle structure of a wild type (wt) Drosophila tracheal tube from a second instar larvae. The cuticle of the main airway is characterized by taenidial folds, running perpendicular to the tube axis. B, the tracheal cuticle of an FH2-expressing larvae is essentially identical to that of the wild type shown in A. C, tracheal tubes in which FH1-FH2 is expressed exhibit a strongly impaired cuticle pattern, often leading to the flattening and collapse of the tubes. Scale bar, 50 μm.
FIGURE 3.
FIGURE 3.
The effect of DAAM-FH2 and DAAM-FH1-FH2 on the polymerization and depolymerization of actin. A, the polymerization rate of actin (3.5 μm, 5% pyrenyl-labeled) at half-maximum polymerization as a function of DAAM concentration derived from pyrenyl or stopped-flow measurements as described under “Experimental Procedures.” Both DAAM-FH2 and DAAM-FH1-FH2 reach their maximal effect at 1 μm. Inset, the time course of actin polymerization (3.5 μm, 5% pyrenyl-labeled) monitored by the change in pyrene fluorescence in the absence or presence of various concentrations of DAAM-FH2, as indicated. The linear fit to each polymerization curve at 50% completion of the polymerization is shown by dashed lines in the corresponding color. B, time lapse evanescent wave fluorescence microscopy of the effect of DAAM formins on the polymerization of actin. Left panels, time lapse micrographs of actin assembly (1.2 μm, 10% Alexa 488-labeled) in the absence or presence of DAAM-FH1-FH2 and DAAM-FH2. Elapsed time (s) is shown. Scale bar, 10 μm. In the presence of DAAM fragments, a 2.67 × 2.67-μm area of the field (marked by a small green square in the first frame) with a single growing filament is enlarged 3-fold and shown at the bottom left corner of the subsequent images. Right panels, changes in filament length as a function of time. The elongation rate of individual filaments (v) was derived from the linear fit to the data. C, barbed end elongation from spectrin-actin seeds (SA; 1.1 nm) at 1 μm G-actin (2% pyrenyl-labeled) in the presence of DAAM-FH2 or DAAM-FH1-FH2, as indicated. Initial barbed end elongation rates were derived from the polymerization curves (shown in the inset) as described under “Experimental Procedures.” The dashed lines are calculated best fit binding curves (see “Experimental Procedures”), leading to half-saturation formin concentrations of 50 ± 6 and 11 ± 4 nm for the FH2 and FH1-FH2 fragments, respectively. Inset, kinetics of barbed end elongation of G-actin from spectrin-actin seeds in the absence or presence of DAAM-FH1-FH2. The yellow and orange curves show controls: time course of actin assembly (1 μm, 2% pyrenyl-labeled) in the absence of spectrin-actin seeds and in the absence or presence of DAAM-FH1-FH2, as indicated. Note that there is no detectable nucleation by DAAM-FH1-FH2 under these experimental conditions. D, pointed end elongation (20 nm gelsolin-actin seeds (GA2)) at 1.25 μm G-actin (2% pyrenyl-labeled) in the presence of DAAM-FH2 or DAAM-FH1-FH2. Initial elongation rates were derived from the polymerization curves (shown in the inset) as described under “Experimental Procedures.” Inset, kinetics of pointed end elongation of G-actin from GA2 in the absence and presence of DAAM-FH2 or DAAM-FH1-FH2. The gray line shows the time course of actin assembly (1.25 μm, 2% pyrenyl-labeled) in the absence of both GA2 and formins. E, dilution-induced depolymerization of F-actin (70% pyrenyl-labeled) in the presence of various concentrations of DAAM-FH2 or DAAM-FH1-FH2. Hyperbola fits to the plots (dashed lines) gave half-saturation formin concentrations of 13 ± 5 and 1 ± 2 nm for the FH2 and FH1-FH2 fragments, respectively.
FIGURE 4.
FIGURE 4.
The interaction of actin, formin, and profilin. A, the polymerization rate of actin (3.5 μm, 5% pyrenyl-labeled) as a function of the formin concentration in the absence or presence of 5 μm profilin. Shown are the data for DAAM-FH2 and FH1-FH2 in the absence (as in Fig. 3A) or presence of profilin, as indicated. B, time lapse evanescent wave fluorescence microscopy of the effect of DAAM formins on the barbed end growth from profilin-actin. Left panels, time lapse micrographs of actin assembly (0.3 μm actin, 10% Alexa 488-labeled; green) from F-actin seeds (10% Alexa 568-labeled; red) in the presence of profilin (0.72 μm) and in the absence or presence of DAAM-FH1-FH2 and DAAM-FH2. The barbed end of typical filaments growing from a red seed or nucleated in solution are marked by red and green arrows in the subsequent images, respectively. Elapsed time (s) is shown. Scale bar, 10 μm. Right panels, kymographs of the length (y axis) of the marked filaments versus time (x axis). The elongation rate of individual filaments (v) was derived from kymograph analysis. C, barbed end elongation from spectrin-actin seeds (SA; 1.1 nm) at 1 μm G-actin in the presence of 2.6 μm profilin and DAAM-FH2 or DAAM-FH1-FH2 derived from the pyrenyl polymerization curves as described under “Experimental Procedures.” The dashed lines are calculated best fit binding curves (see “Experimental Procedures”). For comparison, the values obtained in the absence of profilin are shown in open symbols for DAAM-FH2 and DAAM-FH1-FH2 (see also Fig. 3C). Hyperbola fit to the data obtained in the presence of DAAM-FH2 gave a half-saturation formin concentration of 31 ± 5 nm. D, dependence of barbed end (BE) elongation rate from spectrin-actin seeds (1.1 nm) on profilin-actin (PA) concentration, with either free barbed ends, DAAM-FH2-bound barbed ends (0.53 μm), or DAAM-FH1-FH2-bound barbed ends (0.52 μm), as indicated Profilin concentration was 18.7 μm. The reference plot obtained with free G-actin and free barbed ends is shown in open circles. Values of the association rate constants (k+) derived from the slopes (dashed lines) are shown in Table 1. E, the effect of profilin on the depolymerization rate of actin as a function of the formin concentration. The data are presented for DAAM-FH2 and for DAAM-FH1-FH2 in the absence (as in Fig. 3E) or presence of profilin (5 μm), as indicated.
FIGURE 5.
FIGURE 5.
The effect of DAAM-FH2 and DAAM-FH1-FH2 on the steady-state actin assembly dynamics. A, critical concentration plots of F-actin (5% pyrenyl-labeled) polymerized in the presence of 100 nm DAAM-FH2 or DAAM-FH1-FH2, as indicated. Fitting Equation 2 to the curves gave values of critical concentration of 0.21 ± 0.09 and 0.25 ± 0.073 μm in the presence of DAAM-FH2 or DAAM-FH1-FH2, respectively. Inset, actin (1 μm, 5% pyrenyl-labeled) was polymerized in the presence of various DAAM-FH2 or FH1-FH2 concentrations, as indicated. The concentrations of polymerized actin were derived from pyrenyl fluorescence measurements (see “Experimental Procedures”) and plotted as a function of DAAM concentration. B, the pyrene fluorescence intensity of samples containing different concentrations of actin (5% pyrenyl-labeled) polymerized in the presence of 100 nm DAAM-FH2 or DAAM-FH1-FH2 and profilin (5 μm), as indicated. The critical concentration was found to be 0.42 ± 0.08 μm and 0.22 ± 0.03 μm in the presence of DAAM-FH2 or DAAM-FH1-FH2, respectively. C, the amount of F-actin assembled at steady state (1.97 μm total actin, 2% pyrenyl-labeled) was measured in the absence and presence of either gelsolin, DAAM-FH1-FH2, or DAAM-FH2 and increasing amounts of profilin, as indicated. The data show that whereas the binding of DAAM-FH1-FH2 to barbed ends allows profilin-actin to maintain barbed end dynamics, DAAM-FH2 causes depolymerization of actin by profilin. The capping of barbed ends by gelsolin results in sequestration of actin by profilin. The linear decrease in F-actin upon the addition of profilin in the presence of gelsolin is consistent with the value of 0.56 μm for the critical concentration at pointed ends and a value of 0.36 μm for the equilibrium dissociation constant of profilin-actin complex. Dashed lines in the corresponding colors show the linear fit to the data. a.u., arbitrary units.
FIGURE 6.
FIGURE 6.
DAAM-FH1-FH2-functionalized beads move in the reconstituted biomimetic motility assay. A, left panels, time lapse recording of the propulsive movement of typical beads coated with the FH1-FH2 domain of mDia1 or of DAAM. Right panels, the trajectory of beads. The green, white, and red arrows indicate the initial, intermediate, and final positions of beads, respectively. Conditions were as follows: 7 μm F-actin (5% rhodamine-labeled), 16 μm profilin, 15 μm ADF. Scale bar, 20 μm. Elapsed time (s) is shown. B, kymographs generated using the trajectory of beads (y axis, length; x axis, time). Conditions were as in A. C, time courses of actin polymerization (2 μm, 2% pyrenyl-labeled) monitored by the change in pyrenyl fluorescence in the absence (black line) and in the presence of different formin fragments, as indicated. D, in the absence of profilin, DAAM-FH1-FH2-coated beads do not initiate actin comets in the motility assay. Conditions were as follows: 7 μm F-actin (5% rhodamine-labeled), 15 μm ADF. Scale bar, 10 μm. E, the amount of formin FH1-FH2 bound to the beads after functionalization visualized by Coomassie staining of SDS-polyacrylamide gels.
FIGURE 7.
FIGURE 7.
DAAM-FH2 and DAAM-FH1-FH2 bind to the sides of actin filaments. Left, gels of pellets (P) and supernatants (SN) obtained with either 3 μm DAAM-FH2 or FH2 in the absence of actin. Right, the fraction of DAAM formins bound to F-actin as a function of formin concentration, as indicated. Equation 1 was fitted to the data and gave equilibrium dissociation constants for binding of DAAM fragments to the sides of actin filaments of 7.0 ± 2.5 and 2.1 ± 0.7 μm for the DAAM-FH2 and DAAM-FH1-FH2 fragments, respectively.
FIGURE 8.
FIGURE 8.
DAAM-FH2 and DAAM-FH1-FH2 cross-link actin filaments. A, gallery of typical images of actin filaments (1 μm) polymerized in the absence or presence of either 500 nm DAAM-FH2 or FH1-FH2 (from left to right) visualized by rhodamine phalloidin fluorescence. B, diagram showing the distribution of the thickness of the filament structures formed in the absence or presence of DAAM-FH2 and FH1-FH2, as indicated. a.u., arbitrary units.

References

    1. Le Clainche C., Carlier M. F. (2008) Physiol. Rev. 88, 489–513 - PubMed
    1. Pollard T. D. (2007) Annu. Rev. Biophys. Biomol. Struct. 36, 451–477 - PubMed
    1. Chhabra E. S., Higgs H. N. (2007) Nat. Cell Biol. 9, 1110–1121 - PubMed
    1. Goode B. L., Eck M. J. (2007) Annu. Rev. Biochem. 76, 593–627 - PubMed
    1. Higgs H. N. (2005) Trends Biochem. Sci. 30, 342–353 - PubMed

Publication types

MeSH terms

LinkOut - more resources