. 2010 May 28;285(22):16504-12.
doi: 10.1074/jbc.M109.072140. Epub 2010 Feb 20.

Inhibition of Na+-taurocholate Co-transporting polypeptide-mediated bile acid transport by cholestatic sulfated progesterone metabolites

Affiliations

Inhibition of Na+-taurocholate Co-transporting polypeptide-mediated bile acid transport by cholestatic sulfated progesterone metabolites

Shadi Abu-Hayyeh et al. J Biol Chem. .

Abstract

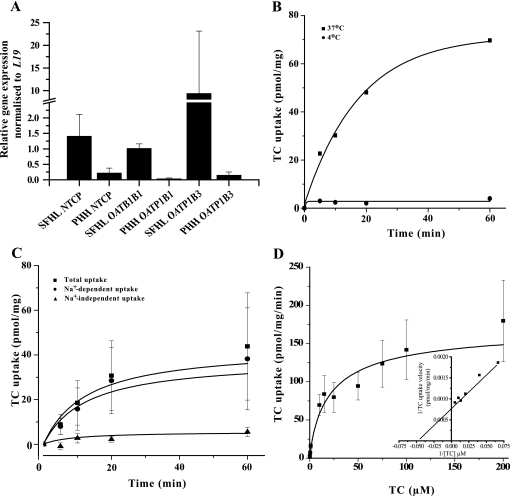
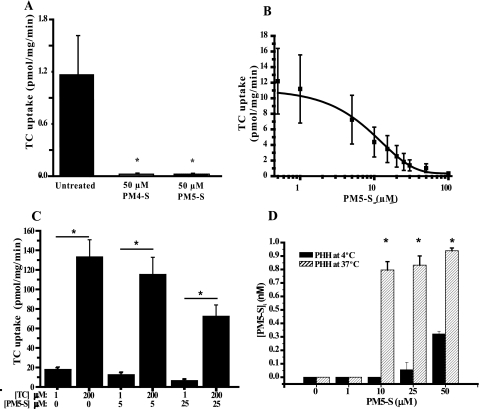
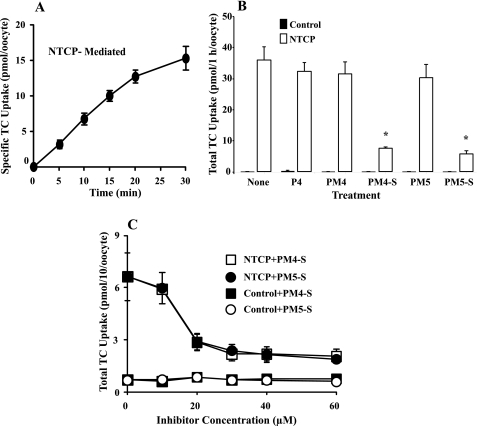
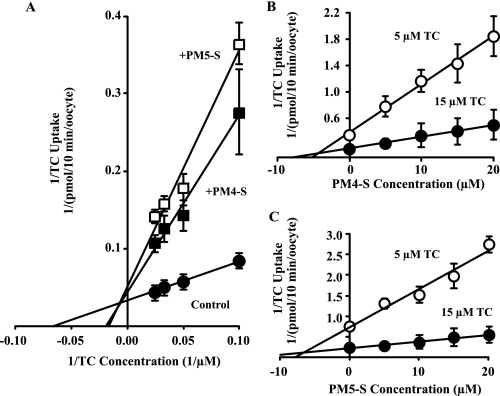
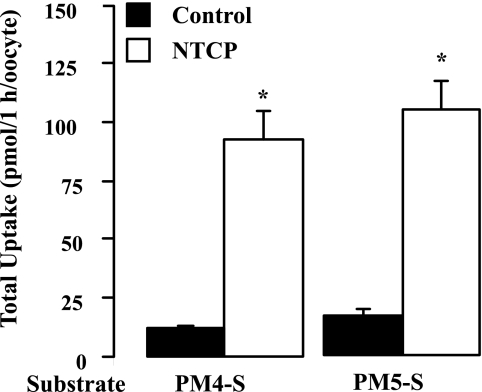
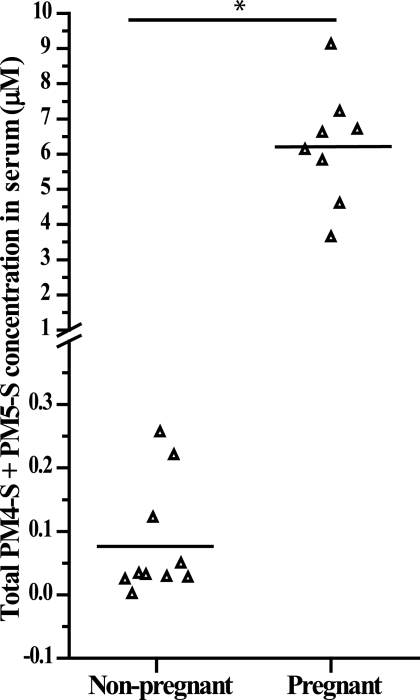
Sulfated progesterone metabolite (P4-S) levels are raised in normal pregnancy and elevated further in intrahepatic cholestasis of pregnancy (ICP), a bile acid-liver disorder of pregnancy. ICP can be complicated by preterm labor and intrauterine death. The impact of P4-S on bile acid uptake was studied using two experimental models of hepatic uptake of bile acids, namely cultured primary human hepatocytes (PHH) and Na(+)-taurocholate co-transporting polypeptide (NTCP)-expressing Xenopus laevis oocytes. Two P4-S compounds, allopregnanolone-sulfate (PM4-S) and epiallopregnanolone-sulfate (PM5-S), reduced [(3)H]taurocholate (TC) uptake in a dose-dependent manner in PHH, with both Na(+)-dependent and -independent bile acid uptake systems significantly inhibited. PM5-S-mediated inhibition of TC uptake could be reversed by increasing the TC concentration against a fixed PM5-S dose indicating competitive inhibition. Experiments using NTCP-expressing Xenopus oocytes confirmed that PM4-S/PM5-S are capable of competitively inhibiting NTCP-mediated uptake of [(3)H]TC. Total serum PM4-S + PM5-S levels were measured in non-pregnant and third trimester pregnant women using liquid chromatography-electrospray tandem mass spectrometry and were increased in pregnant women, at levels capable of inhibiting TC uptake. In conclusion, pregnancy levels of P4-S can inhibit Na(+)-dependent and -independent influx of taurocholate in PHH and cause competitive inhibition of NTCP-mediated uptake of taurocholate in Xenopus oocytes.


Figures

FIGURE 1.
FIGURE 1.
Characterization of cultured PHH bile acid transporters. A, relative gene expression levels (PHH relative to snap-frozen human liver (SFHL)) of hepatic bile acid uptake transporters NTCP, OATP1B1, and OATP1B3 normalized to L19 in PHH cultured for 24 h and in snap-frozen human liver. Values represent mean ± S.D. of n ≥3. B, representation of typical [3H]TC (0.2 μm) uptake time course. C, time course of PHH temperature-sensitive Na+-dependent and Na+-independent [3H]TC uptake (0.2 μm) in PHH. Na+-dependent uptake was calculated as the difference between total uptake and Na+-independent uptake. D, TC dose-response curve. PHH were incubated with fixed 0.2 μm [3H]TC and increasing concentrations of unlabeled TC. Inset graph is a representation of typical double-reciprocal plot of TC uptake velocity versus TC concentration focusing on the 15–200 μm TC concentration range. Values represent mean ± S.E. of n ≥3.
FIGURE 2.
FIGURE 2.
Impact of P4-S on PHH bile acid uptake. A, PHH incubated with 0.2 μm [3H]TC and 50 μm PM4-S/PM5-S for 5 min. *, p < 0.05 for total uptake with PM4-S/PM5-S versus total uptake. B, PM5-S dose-response curve. PHH incubated with 1 μm TC (0.2 μm [3H]TC + 0.8 μm TC) and variable PM5-S concentrations for 5 min. C, mode of inhibition of TC uptake mediated by PM5-S. PHH were incubated with 0.2 μm [3H]TC and unlabeled TC to make a final concentration of 1 or 200 μm, with/without 5 or 25 μm PM5-S for 5 min. *, p < 0.05 for PHH incubated with 200 μm TC versus 1 μm TC at all PM5-S concentrations. D, intracellular concentrations of PM5-S in PHH after incubation with PM5-S. PHH were incubated with 0–50 μm PM5-S for 10 min. GC-MS was used to quantify intracellular PM5-S levels. *, p < 0.05 for PM5-S-treated groups versus untreated control. Values represent mean ± S.E. of n = 3.
FIGURE 3.
FIGURE 3.
Impact of P4-S on NTCP-transfected oocyte bile acid uptake. A, time course of specific NTCP-mediated uptake of [3H]TC in NTCP-transfected Xenopus oocytes incubated with 10 μm TC at 25 °C. B, total uptake of TC by wild-type and NTCP-expressing oocytes that were incubated with 10 μm TC in the absence or presence of 30 μm progesterone (P4)/metabolite at 25 °C for 1 h. C, PM4-S/PM5-S dose response; Xenopus oocytes were incubated with 10 μm TC and variable PM4-S/PM5-S concentrations. Values are mean ± S.D. of n = 3, 10 oocytes/experiment (from three frogs). *, p < 0.05 for oocytes incubated with inhibitor versus those without as determined by the Bonferroni method for multiple range testing.
FIGURE 4.
FIGURE 4.
Mode of PM4-S/PM5-S-mediated bile acid uptake inhibition in NTCP-transfected oocytes. A, representative double-reciprocal plot of specific NTCP-mediated uptake of [3H]TC by NTCP-expressing oocytes. Oocytes were incubated with varying concentrations of TC without inhibitor or with PM4-S/PM5-S (B and C). Dixon's plots of specific NTCP-mediated uptake of [3H]TC by NTCP-expressing oocytes with varying concentrations of PM4-S (B), PM5-S (C) and 5 or 15 μm TC at 25 °C for 10 min. Values are mean ± S.D., 10 oocytes/data point. All regression lines were p < 0.001.
FIGURE 5.
FIGURE 5.
NTCP-expressing oocytes are able to uptake PM4-S and PM5-S. Total uptakes of PM4-S/PM5-S by wild-type and NTCP-expressing Xenopus oocytes were incubated with 30 μm of each P4-S at 25 °C for 1 h. Measurements were carried out by HPLC-MS/MS in 15 individual oocytes/data point (from three different frogs). Determinations of PM4-S and PM5-S content were corrected by the recovery of internal standard (taurosulfolithocholic acid) added to the lysis/extraction solution. Values are mean ± S.D. *, p < 0.05 for NTCP-expressing oocytes versus control oocytes as determined by the Student's t test.
FIGURE 6.
FIGURE 6.
Serum concentrations of total PM4-S + PM5-S in fasted non-pregnant and 30–38-week pregnant women. Black line represents mean serum concentrations of total PM4-S + PM5-S. Measurements were carried out by liquid chromatography-electrospray tandem mass spectrometry on a minimum of n = 8 samples. *, p < 0.05 for non-pregnant versus pregnant serum samples as determined by the Student's t test.

Similar articles

Cited by

References

    1. Pascual M. J., Serrano M. A., El-Mir M. Y., Macias R. I., Jiménez F., Marin J. J. (2002) Clin. Sci. 102, 587–593 - PubMed
    1. Castaño G., Lucangioli S., Sookoian S., Mesquida M., Lemberg A., Di Scala M., Franchi P., Carducci C., Tripodi V. (2006) Clin. Sci. 110, 459–465 - PubMed
    1. Glantz A., Marschall H. U., Mattsson L. A. (2004) Hepatology 40, 467–474 - PubMed
    1. Williamson C., Hems L. M., Goulis D. G., Walker I., Chambers J., Donaldson O., Swiet M., Johnston D. G. (2004) BJOG 111, 676–681 - PubMed
    1. Dixon P. H., Williamson C. (2008) Obs. Med. 1, 65–71 - PMC - PubMed

Publication types

MeSH terms

LinkOut - more resources