. 2010 Apr 23;285(17):12595-603.
doi: 10.1074/jbc.M109.008581. Epub 2010 Feb 22.

A cleavage-resistant urokinase plasminogen activator receptor exhibits dysregulated cell-surface clearance

Affiliations

A cleavage-resistant urokinase plasminogen activator receptor exhibits dysregulated cell-surface clearance

Evelyn C Nieves et al. J Biol Chem. .

Abstract

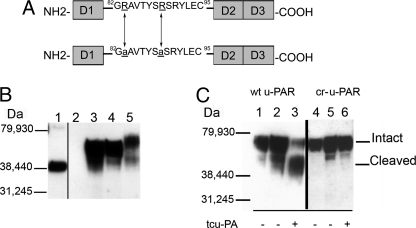
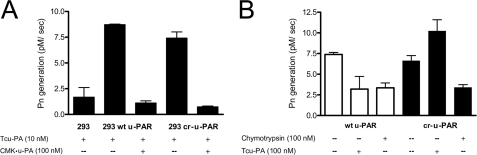
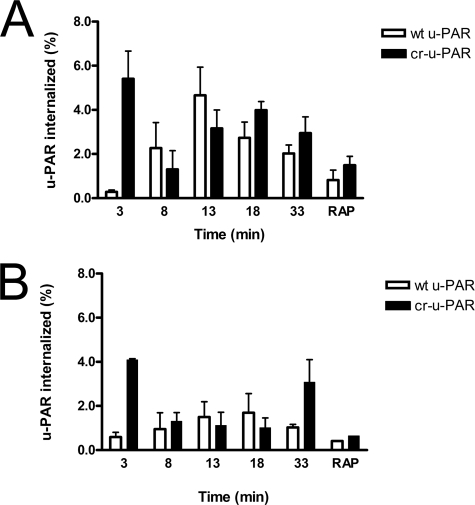
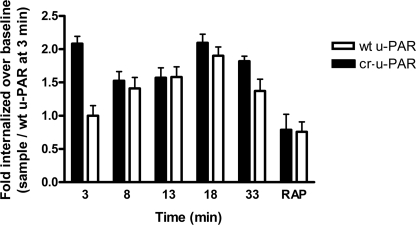
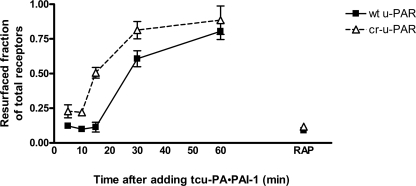
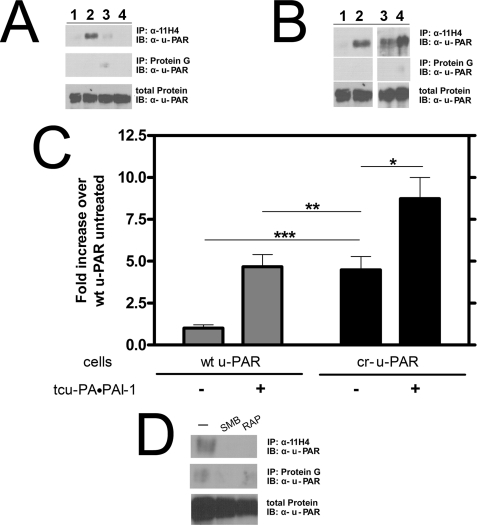
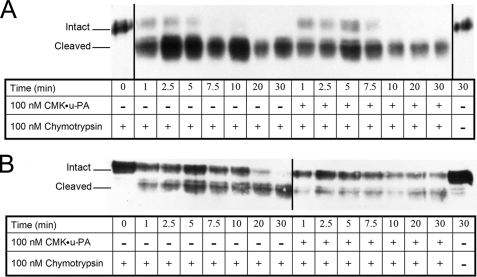
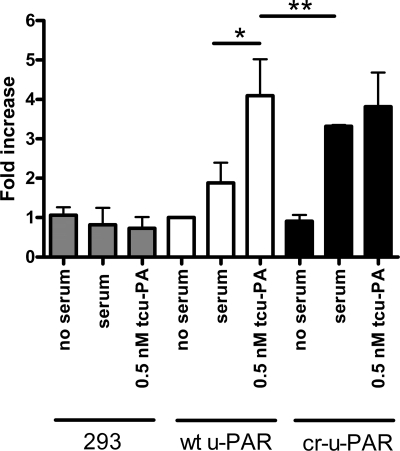
Urokinase plasminogen activator receptor (u-PAR) binds urokinase plasminogen activator (u-PA) and participates in plasminogen activation in addition to modulating several cellular processes such as adhesion, proliferation, and migration. u-PAR is susceptible to proteolysis by its cognate ligand and several other proteases. To elucidate the biological significance of receptor cleavage by u-PA, we engineered and expressed a two-chain urokinase plasminogen activator (tcu-PA) cleavage-resistant u-PAR (cr-u-PAR). This mutated receptor was similar to wild-type u-PAR in binding u-PA and initiating plasminogen activation. However, cr-u-PAR exhibited accelerated internalization and resurfacing due to direct association with the endocytic receptor alpha(2)-macroglobulin receptor/low density lipoprotein receptor-related protein in the absence of the enzyme x inhibitor complex of tcu-PA and plasminogen activator inhibitor-1 (tcu-PA.PAI-1). cr-u-PAR-expressing cells had enhanced migration compared with wild-type u-PAR-expressing cells, and cr-u-PAR was less sensitive to chymotrypsin cleavage as compared with wt u-PAR. Our studies suggest that these mutations in the linker region result in a rearrangement within the cr-u-PAR structure that makes it resemble its ligand-bound form. This constitutively active variant may mimic highly glycosylated cleavage-resistant u-PAR expressed in certain highly malignant cancer-cells.


Figures

FIGURE 1.
FIGURE 1.
Domain structure, expression, and cleavage products of u-PAR. A, a diagram of wt u-PAR (top) shows the three domains designated D1–3 and a linker region. D3 contains the glycosylphosphatidylinositol anchor. The linker region contains the chemotactic epitope (59). A schematic of cr-u-PAR (bottom) shows the two mutated sites as underlined and in lowercase. B, immunoblotting using polyclonal rabbit α-u-PAR was used to detect total u-PAR. Samples were 125 ng of purified su-PAR as a positive control (lane 1) and lysates from non-transfected 293 cells (lane 2), 293 wt u-PAR cells (lane 3), 293 cr-u-PAR cells (lane 4), and 3-day PMA-stimulated U937 cells (lane 5). C, u-PAR cleavage products post-exposure to tcu-PA. Cells expressing wt u-PAR (lanes 1–3) or cr-u-PAR (lanes 4–6) were incubated in the absence of tcu-PA for 0 h (lanes 1 and 4) or 20 h (lanes 2 and 5) or in the presence of 100 nm tcu-PA for 20 h (lanes 3 and 6) followed by lysis, SDS-PAGE, and immunoblotting for total u-PAR.
FIGURE 2.
FIGURE 2.
Cr-u-PAR supports u-PA-dependent Pg activation that cannot be down-regulated by receptor cleavage. A, specific binding of tcu-PA to u-PAR leads to Pn generation that can be blocked by preincubation with excess CMK·u-PA. Cells were first incubated with or without 100 nm of CMK·u-PA for 30 min at 37 °C followed by 10 nm of tcu-PA. Cell-surface u-PA activity was measured via a Pg activation assay as described under “Experimental Procedures.” B, proteolysis of u-PAR results in a decrease in cell-surface Pn generation. Cells expressing wt u-PAR (white bars) or cr-u-PAR (black bars) were subjected to limited proteolysis with 10 nm chymotrypsin or 100 nm tcu-PA, and residual intact u-PAR was detected by incubation with 10 nm of tcu-PA followed by a Pg activation assay. Data represent the mean and S.D. of three individual replicates.
FIGURE 3.
FIGURE 3.
cr-u-PAR is internalized rapidly compared with wt u-PAR. Cells expressing wt u-PAR (white bars) and cr-u-PAR (black bars) were briefly surface-labeled with reducible biotin and incubated with 10 nm tcu-PA·PAI-1 complex (A) or buffer (B) at 4 °C. Internalization was initiated by exposure to 37 °C and terminated via cell-surface reduction with dithiothreitol and cell lysis, with time points representing the duration of incubation at 37 °C plus the dithiothreitol exposure. 500 nm RAP was added to the control reaction with every new incubation. Internalized non-reduced u-PAR was isolated and detected as described. Total u-PAR was detected by subjecting 20 μl of total cell lysate to SDS-PAGE and immunoblotting. Data represent the amount of non-reduced u-PAR (internalized) as a percentage of total u-PAR in each sample, and shown are the means ± S.E. of at least three independent replicates.
FIGURE 4.
FIGURE 4.
cr-u-PAR promotes biotinylated-PAI-114–1B·tcu-PA complex internalization. 293 wt u-PAR (white bars) and cr-u-PAR (black bars) cells were incubated with 10 nm biotinylated-PAI-114–1B·tcu-PA complex at 4 °C, and internalization was initiated at 37 °C and terminated as described earlier. Cells were acid-washed to remove non-internalized cell-surface-bound biotinlyated-PAI-I14–1B·tcu-PA complex. Time points represent the duration of the 37 °C incubation plus the acid wash. Internalized biotinylated complex was detected as described with streptavidin-HRP, and the amount of complex internalized by wt u-PAR cells at 3 min was set as baseline. As a control, RAP (500 nm) was incubated with tcu-PA·PAI-1 with continuous addition of RAP following incubation for 30 min at 37 °C. Data represent the mean ± S.E. of minimum three independent replicates.
FIGURE 5.
FIGURE 5.
Cells expressing cr-u-PAR resurface recently unoccupied receptor faster than wt u-PAR-expressing cells. wt u-PAR (■) and cr-u-PAR (Δ)-expressing cells were incubated with pre-assembled tcu-PA·PAI-1 complexes at 4 °C. Cells were washed and incubated at 37 °C for the times shown, and the amount of resurfaced unoccupied receptor was assessed via a Pg activation assay. Pg activating activities at each time point are shown relative to samples of cells not incubated with tcu-PA·PAI-1 complex, leaving a full complement of unoccupied u-PAR. As a control, 500 nm RAP was added to each incubation step. Data represent the means ± S.E. of four independent replicates.
FIGURE 6.
FIGURE 6.
cr-u-PAR co-immunoprecipitates with LRP in the absence of tcu-PA·PAI-1 complexes. A, cells expressing wt u-PAR were incubated with buffer (lane 1), 10 nm tcu-PA·PAI-1 (lane 2), 500 nm RAP (lane 3), or 500 nm RAP, and 10 nm tcu-PA·PAI-1 complex (lane 4). u-PAR was affinity-precipitated with the monoclonal α-LRP antibody, 11H4, and detected using polyclonal α-u-PAR antibody. Nonspecific binding of u-PAR to protein G beads was minimal. B, cells expressing wt u-PAR (lanes 1 and 2) or cr-u-PAR (lanes 3 and 4) were incubated in the absence (lanes 1 and 3) or presence (lanes 2 and 4) of 10 nm tcu-PA·PAI-1 complex and u-PAR affinity-precipitated as described under “Experimental Procedures.” The band intensities are shown (C), with data representing the mean ± S.D. of three individual replicates (t test; *, p < 0.03; **, not significant; and ***, p < 0.0005). D, cr-u-PAR-expressing cells were treated with buffer only (lane 1), 4 μm SMB (lane 2), or 500 nm RAP (lane 3) for 30 min before lysis and immunoprecipitation with α-LRP antibody followed by immunoblotting with α-u-PAR antibody.
FIGURE 7.
FIGURE 7.
Chymotrypsin cleaves cr-u-PAR less efficiently compared with wt u-PAR. Suspension of cells expressing wt u-PAR (A) or cr-u-PAR (B) were incubated with buffer or 100 nm CMK·u-PA as shown at 37 °C, followed by additional incubation with 100 nm chymotrypsin at 37 °C for the times shown. 10 μg of total cell lysate was analyzed by immunoblotting using polyclonal rabbit α-u-PAR. Blots were imaged using the Kodak 1D system. Shown are images representative of four independent replicates.
FIGURE 8.
FIGURE 8.
293 cr-u-PAR-expressing cells promote u-PA-independent migration. Non-transfected 293 (gray bars)-, 293 wt u-PAR (white bars)-, and 293 cr-u-PAR (black bars)-expressing cells were serum-starved and suspended in serum-free DMEM. Cells were either pre-treated with serum-free DMEM and allowed to migrate over Vtn-coated chambers with no serum gradient (no serum), pre-treated with serum-free DMEM and allowed to migrate toward 10% fetal calf serum (serum), or pre-treated with 0.5 nm tcu-PA and allowed to migrate toward 10% fetal calf serum (0.5 nm tcu-PA) for 2 h at 37 °C. Samples were analyzed as described under “Experimental Procedures.” Data represent the means ± S.D. of at least three individual replicates and were analyzed using a Student's t test (*, p < 0.0001 and **, not significant).

Similar articles

Cited by

References

    1. Ploug M., Rahbek-Nielsen H., Nielsen P. F., Roepstorff P., Dano K. (1998) J. Biol. Chem. 273, 13933–13943 - PubMed
    1. Blasi F., Stoppelli M. P., Cubellis M. V. (1986) J. Cell. Biochem. 32, 179–186 - PubMed
    1. Møller L. B., Pöllänen J., Rønne E., Pedersen N., Blasi F. (1993) J. Biol. Chem. 268, 11152–11159 - PubMed
    1. Chapman H. A., Wei Y., Simon D. I., Waltz D. A. (1999) Thromb. Haemost. 82, 291–297 - PubMed
    1. Nguyen D. H., Hussaini I. M., Gonias S. L. (1998) J. Biol. Chem. 273, 8502–8507 - PubMed

MeSH terms

Substances

LinkOut - more resources