. 2010 Apr 23;285(17):13092-106.
doi: 10.1074/jbc.M109.078360. Epub 2010 Feb 22.

Ataxia telangiectasia mutated (ATM) inhibition transforms human mammary gland epithelial cells

Affiliations

Ataxia telangiectasia mutated (ATM) inhibition transforms human mammary gland epithelial cells

Stefano J Mandriota et al. J Biol Chem. .

Abstract

Carriers of mutations in the cell cycle checkpoint protein kinase ataxia telangiectasia mutated (ATM), which represent 1-2% of the general population, have an increased risk of breast cancer. However, experimental evidence that ATM deficiency contributes to human breast carcinogenesis is lacking. We report here that in MCF-10A and MCF-12A cells, which are well established normal human mammary gland epithelial cell models, partial or almost complete stable ATM silencing or pharmacological inhibition resulted in cellular transformation, genomic instability, and formation of dysplastic lesions in NOD/SCID mice. These effects did not require the activity of exogenous DNA-damaging agents and were preceded by an unsuspected and striking increase in cell proliferation also observed in primary human mammary gland epithelial cells. Increased proliferation correlated with a dramatic, transient, and proteasome-dependent reduction of p21(WAF1/CIP1) and p27(KIP1) protein levels, whereas little or no effect was observed on p21(WAF1/CIP1) or p27(KIP1) mRNAs. p21(WAF1/CIP1) silencing also increased MCF-10A cell proliferation, thus identifying p21(WAF1/CIP1) down-regulation as a mediator of the proliferative effect of ATM inhibition. Our findings provide the first experimental evidence that ATM is a human breast tumor suppressor. In addition, they mirror the sensitivity of ATM tumor suppressor function and unveil a new mechanism by which ATM might prevent human breast tumorigenesis, namely a direct inhibitory effect on the basal proliferation of normal mammary epithelial cells.


Figures

FIGURE 1.
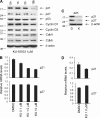
FIGURE 1.
shRNA-mediated stable silencing of ATM and functional analysis of ATM-deficient MCF-10A cells. A, Western blotting for ATM and NBS1 on total protein extracts of MCF-10A, MCF-12A, C26Ci, or HaCaT cells stably transfected with ATM shRNA vector 4, 5, or 6 (kd4, kd5, or kd6, respectively) or with a LacZ shRNA vector as a control (LacZ). The numbers on the left indicate kDa. One of at least two experiments with similar results per cell line is shown. B, MCF-10Akd4 cells (kd4) or MCF-10ALacZ cells (LacZ) were incubated for 30 min in the absence or presence of 20 nm neocarzinostatin. Total protein extracts prepared in the presence of phosphatase inhibitors were analyzed by Western blotting for ATM Ser(P)-1981, ATM, NBS1 Ser(P)-343, NBS1, p53 Ser(P)-15, p53, or β-actin. The numbers on the left indicate kDa. One of three experiments with similar results is shown. C, MCF-10Akd4 cells or MCF-10ALacZ cells were incubated for 30 min in the presence of 100 μm etoposide or DMSO alone as a control, pulsed with 20 μm EdU for 20 min, trypsinized, fixed in 4% paraformaldehyde, and stained with Alexa Fluor 488 azide for replicative DNA synthesis. The graph shows the amount of DNA synthesis in etoposide-treated cells relative to cells treated with DMSO alone with or without S.E. from three independent experiments. *, p = 0.026, t test. D, MCF-10Akd4 cells or MCF-10ALacZ cells were incubated for 18 h in the absence or presence of 10 μm etoposide, pulsed with 10 μm EdU for 4 h, harvested, fixed in 4% paraformaldehyde, and stained with Alexa Fluor 488 azide for replicative DNA synthesis and with 7-aminoactinomycin D for DNA content. The graph shows the number of cells in S phase in etoposide-treated cells relative to cells treated with DMSO alone ± S.E. from three independent experiments. *, p = 0.027, t test.
FIGURE 2.
FIGURE 2.
ATM silencing or inhibition selectively transforms MCF-10A cells. A, MCF-10ALacZ cells 52 PDs after transfection; MCF-10Akd5 cells 20 PDs after transfection; MCF-10Akd6 cells 22 PDs after transfection; HaCaTLacZ cells or HaCaTkd6 cells 57 PDs after transfection; MCF-10A parental cell line incubated in the presence of DMSO alone (D) or 1 μm KU-55933 (KU) for 20 PDs. Bar, 100 μm. B, Western blotting for ATM or NBS1 on fully transformed cultures of MCF-10Akd4, MCF-10Akd5, MCF-10Akd6, or passage-matched MCF-10ALacZ cells. C, lactate measurement in the medium of MCF-10ALacZ cells (LacZ), passage-matched transformed MCF-10Akd4 cells (kd4), or MCF-10A cells grown for 65 PDs in the presence of KU-55933 1 μm or DMSO alone. Error bars, S.E. *, p = 0.016, n = 3, t test. D, proliferation of transformed MCF-10Akd4 cells (purple squares) or of passage-matched MCF-10ALacZ cells (blue triangles). Cells were seeded at a density of 6.6 × 10³ cells/cm2 and grown in medium containing 1% horse serum without additional mitogens for 12 days. Values on the y axis represent the mean number of cells ± S.E. per field. Cells were counted in 12 randomly selected fields of 0.54 mm2 and normalized by the number of attached cells on day 1 (16 h after seeding). Results are from two independent experiments, each using two different transfections (n = 4). *, p = 0.01; #, p = 0.0005, t test.
FIGURE 3.
FIGURE 3.
Transformed MCF-10A or MCF-12A cells with stable ATM silencing grow in agarose gels and invade three-dimensional matrices (Matrigel). A, phase-contrast view of cells grown for 14 days in agarose gels. Bar, 100 μm. B, the growth in agarose gels of MCF-7, MCF-10Akd4, MCF-12Akd4, and MCF-10Akd6 cells or the respective, passage-matched LacZ shRNA-expressing controls (LacZ) was quantified by measuring the diameter of the structures formed after 14 days. At least 100 randomly selected structures (single cells or multicellular colonies) from two independent experiments/condition were measured. *, p = 1.22 × 10⁻⁹, t test. C, phase-contrast view of MCF-10A stable transfectants grown for 7 days in Matrigel. Results are from at least two experiments per cell line. Bar, 100 μm.
FIGURE 4.
FIGURE 4.
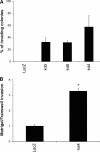
Quantification of Matrigel invasion. A, the graph shows the percentage of colonies formed in Matrigel by morphologically transformed MCF-10Akd5, MCF-10Akd6, MCF-10Akd4, or passage-matched MCF-10ALacZ cells and provided with cytoplasmic or cellular outgrowths ± S.E. from at least three experiments/cell line. A total of at least 100 colonies/cell line were counted. For MCF-10Akd6 versus MCF-10Akd4 cells, p = 0.023, t test; for MCF-10Akd5 versus MCF-10Akd4 cells, p = 0.072, t test. B, Transwells (8.0-μm membrane pores) were coated with 100 μl of 1 mg/ml Matrigel for 5 h at 37 °C. 1 × 10⁵ cells were added to the top chamber and allowed to migrate for 10 h at 37 °C. The graph shows the relative number of cells migrated to the lower surface of the membrane ± S.E. from four independent experiments performed in triplicate. *, p = 3.37 × 10⁻¹⁴, t test.
FIGURE 5.
FIGURE 5.
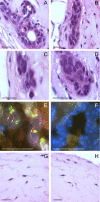
Transformed MCF-12Akd4 cells form dysplastic lesions in vivo. Transformed MCF-12Akd4 cells (A–E), or passage-matched MCF-12ALacZ cells (G and H) were resuspended in growth factor-reduced Matrigel and injected into the mammary fat pad of NOD/SCID female mice. The mice were sacrificed and analyzed after 3 months. A–D, G and H, hematoxylin-eosin staining. E, FISH for human HER2/neu (white arrows) or α satellite DNA located at the centromere of human chromosome 17 (green arrows). F, FISH on the mouse mammary epithelium on the same section. Bar, 20 μm.
FIGURE 6.
FIGURE 6.
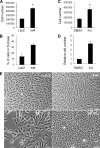
ATM inhibition increases proliferation in MCF-10A and HMGE cells. A, untransformed MCF-10Akd4 (kd4) or passage-matched MCF-10ALacZ (LacZ) cells (both 10 PDs after transfection) were seeded in 6-well plates at 2 × 10⁴ cells/well and counted after 1 week. Values on the y axis represent the mean number of cells ± S.E. from three independent experiments. *, p = 1.01−15, t test. B, in parallel cultures, untransformed MCF-10Akd4 or passage-matched MCF-10ALacZ cells (both 10 PDs after transfection) were pulsed with 20 μm EdU for 20 min, trypsinized, fixed in 4% paraformaldehyde, stained with the Click-iT EdU Alexa Fluor 488 flow cytometry assay kit, and analyzed by flow cytometry. Error bars, S.D. from two independent experiments. C, MCF-10A cells were seeded in 6-well plates at 5 × 10³ cells/well, incubated with 1 μm KU-55933 (KU) or DMSO alone as a control for 1 week, and counted. Values on the y axis represent the mean number of cells ± S.E. from three independent experiments. *, p = 1.29−08, t test. D, HMGE cells cultured for 3 weeks in the presence of DMSO alone or 1 μm KU-55933 were seeded in 6-well plates at 2 × 10⁴ cells/well, grown in the presence of 1 μm KU-55933 or DMSO alone as a control for a further week, and counted. Values on the y axis represent the increase in the number of cells ± S.D. from two independent experiments relative to treatment with DMSO alone. E, phase-contrast view of MCF-10ALacZ cells, MCF-10Akd4 cells, and HMGE cells incubated with DMSO alone (D) or with 1 μm KU-55933 at the end of the proliferation assay. Bar, 100 μm.
FIGURE 7.
FIGURE 7.
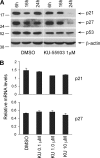
ATM inhibition reduces p21WAF1/CIP1 and p27KIP1 protein expression in HMGE cells. A, HMGE cells were incubated for the indicated times with 1 μm KU-55933 or DMSO. Total protein extracts were analyzed by Western blotting for p21WAF1/CIP1, p27KIP1, p53, or β-actin. B, real-time PCR analysis of p21WAF1/CIP1 and p27KIP1 in HMGE cells incubated for 24 h in the presence of the indicated concentrations of KU-55933 (KU) or DMSO alone. Error bars, S.D.; n = 2.
FIGURE 8.
FIGURE 8.
ATM inhibition reduces p21WAF1/CIP1 and p27KIP1 protein expression in MCF-10A cells. A, MCF-10A cells were incubated for the indicated times with 1 μm KU-55933 or left untreated (0 h). Total protein extracts were analyzed by Western blotting for p21WAF1/CIP1, p27KIP1, p53, cyclin D1, cyclin D3, Cdk4, Cdk6, or β-actin. One of three experiments with similar results is shown. B, real-time PCR analysis of p21WAF1/CIP1 and p27KIP1 in MCF-10A cells incubated for 16 h in the presence of the indicated concentrations of KU-55933 (KU) or DMSO alone. Error bars, S.E.; n = 3. C, MCF-10A cells were incubated for 42 h with 1 μm KU-55933 (K) or DMSO (D). Total protein extracts were analyzed by Western blotting for p21WAF1/CIP1, p27KIP1, or β-actin. One of two experiments with similar results is shown. D, real-time PCR analysis of p21WAF1/CIP1 and p27KIP1 in MCF-10A cells incubated for 42 h in the presence of 1 μm KU-55933 or DMSO alone. Error bars, S.D.; n = 2.
FIGURE 9.
FIGURE 9.
Proteasome inhibition rescues p21WAF1/CIP1 and p27KIP1 protein down-regulation mediated by ATM inhibition. MCF-10A cells were incubated for 23 h in the presence or absence of KU-55933 1 μm, followed by 1 h in the presence or absence of epoxomicin 1 μm as indicated (p21WAF1/CIP1; top); or for 20 h in the presence or absence of KU-55933 1 μm, followed by 4 h in the presence or absence of epoxomicin 1 μm as indicated (p27KIP1; bottom). KU-55933 or epoxomicin were diluted 1:1000 in the culture medium starting from 1 mm stocks in DMSO. The same volume (1:1000) of DMSO was added to controls as indicated (−). Total protein extracts were analyzed by Western blotting for p21WAF1/CIP1 or p27KIP1. One of two experiments with similar results is shown.
FIGURE 10.
FIGURE 10.
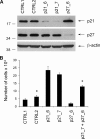
Transient RNA interference for p21WAF1/CIP1 increases MCF-10A cell proliferation. A, MCF-10A cells were transfected with p21WAF1/CIP1 (p21_6 or p21_7) or p27KIP1 (p27_6) siRNAs or with two different control siRNAs (CTRL1 or CTRL2). 48 h after transfection, the cells were lysed and analyzed by Western blotting for p21WAF1/CIP1 or p27KIP1. B, 5 × 10³ MCF-10A cells/well in 6-well plates were transfected with p21WAF1/CIP1 (p21_6 or p21_7) siRNAs, p27KIP1 (p27_6) siRNA, p21_7 and p27_6 siRNAs in combination or with two different control siRNAs (CTRL1 or CTRL2). The cells were counted after 1 week with a hemocytometer. The graph shows the number of cells ± S.E. from three independent experiments performed in quadruplicate, except for p21_6, for which two experiments were performed and where the error bar indicates S.D. *, CTRL2 versus p21_7 + p27_6, p = 0.00017, t test.

Similar articles

Cited by

References

    1. Lavin M. F. (2008) Nat. Rev. Mol. Cell Biol. 9, 759–769 - PubMed
    1. Renwick A., Thompson D., Seal S., Kelly P., Chagtai T., Ahmed M., North B., Jayatilake H., Barfoot R., Spanova K., McGuffog L., Evans D. G., Eccles D., Easton D. F., Stratton M. R., Rahman N. (2006) Nat. Genet. 38, 873–875 - PubMed
    1. Hall J. (2005) Cancer Lett. 227, 105–114 - PubMed
    1. Maillet P., Bonnefoi H., Vaudan-Vutskits G., Pajk B., Cufer T., Foulkes W. D., Chappuis P. O., Sappino A. P. (2002) J. Med. Genet. 39, 751–753 - PMC - PubMed
    1. Weil M. M., Kittrell F. S., Yu Y., McCarthy M., Zabriskie R. C., Ullrich R. L. (2001) Oncogene 20, 4409–4411 - PubMed

Publication types

MeSH terms

Substances