. 2010 Mar;254(3):718-28.
doi: 10.1148/radiol.09090527.

Heterogeneous microinfarcts caused by coronary microemboli: evaluation with multidetector CT and MR imaging in a swine model

Affiliations

Heterogeneous microinfarcts caused by coronary microemboli: evaluation with multidetector CT and MR imaging in a swine model

Marcus Carlsson et al. Radiology. 2010 Mar.

Abstract

Purpose: To directly compare the sensitivity of 64-section multidetector computed tomography (CT) with that of 1.5-T magnetic resonance (MR) imaging in the depiction and measurement of heterogeneous 7-8-week-old microinfarcts and the quantification of regional left ventricular (LV) function and perfusion in the territory of coronary intervention in a swine model.

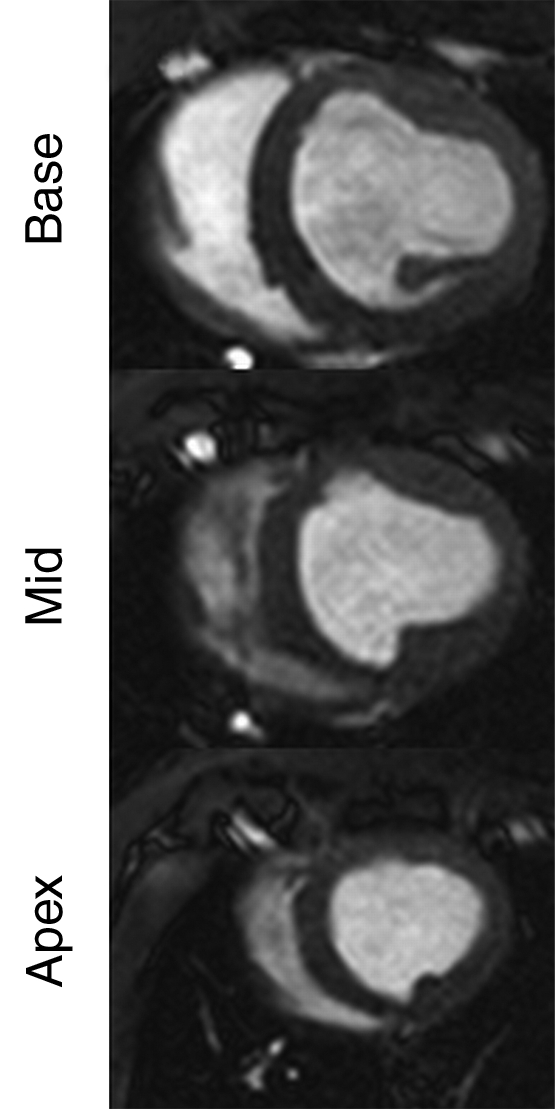
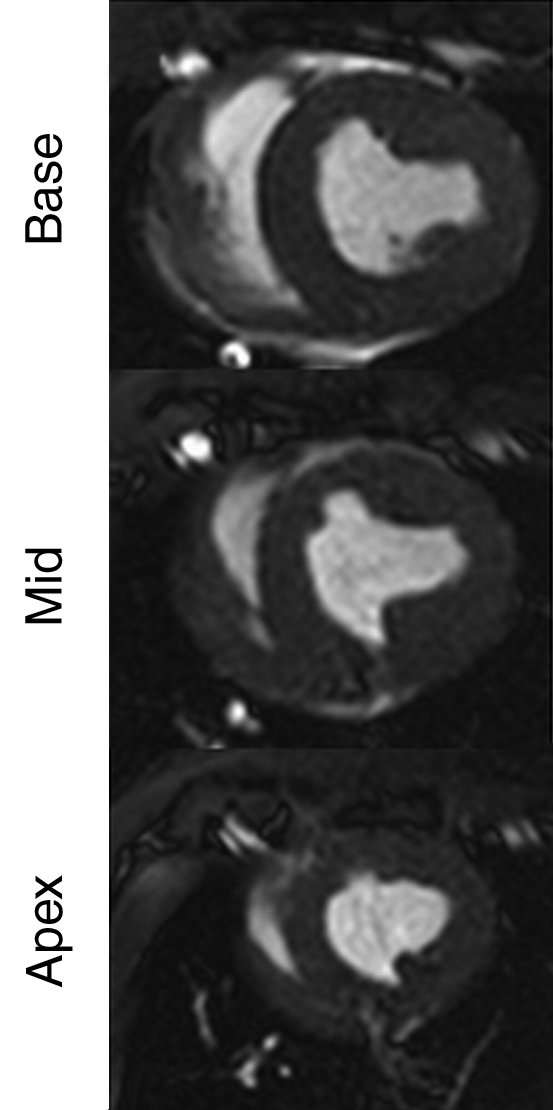
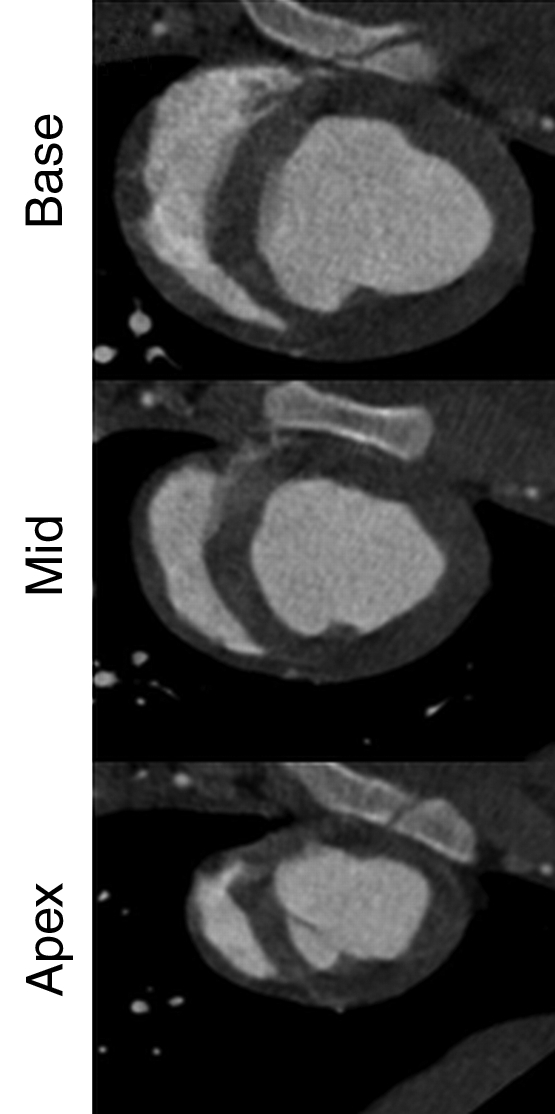
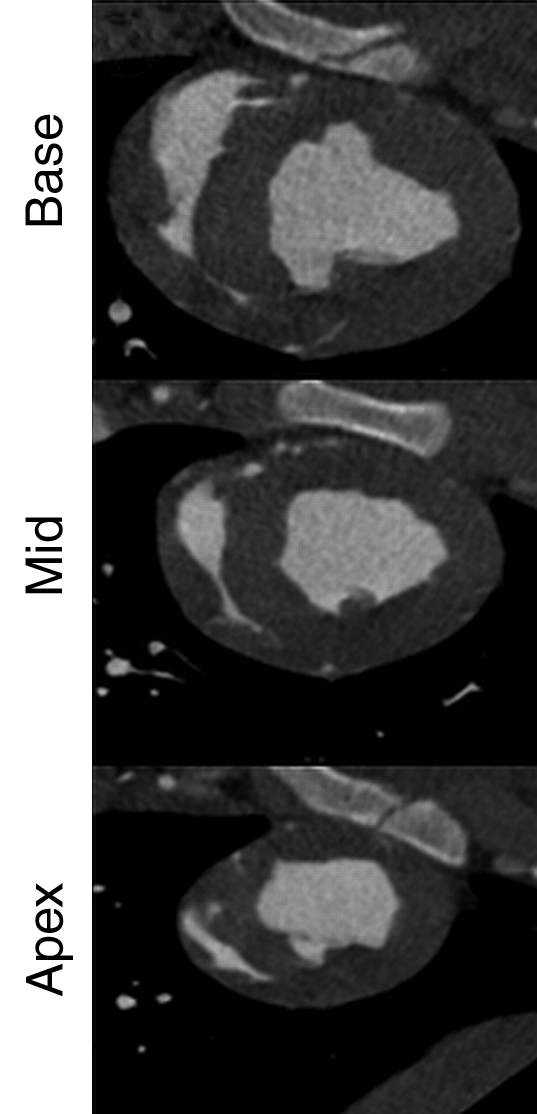
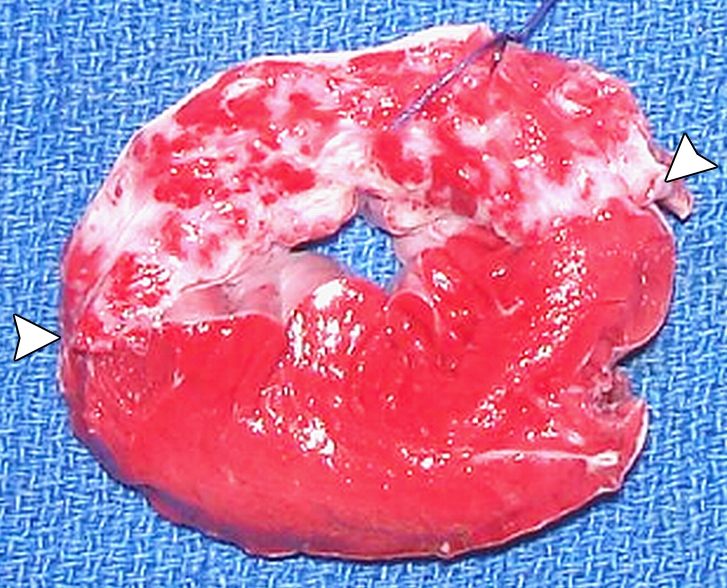
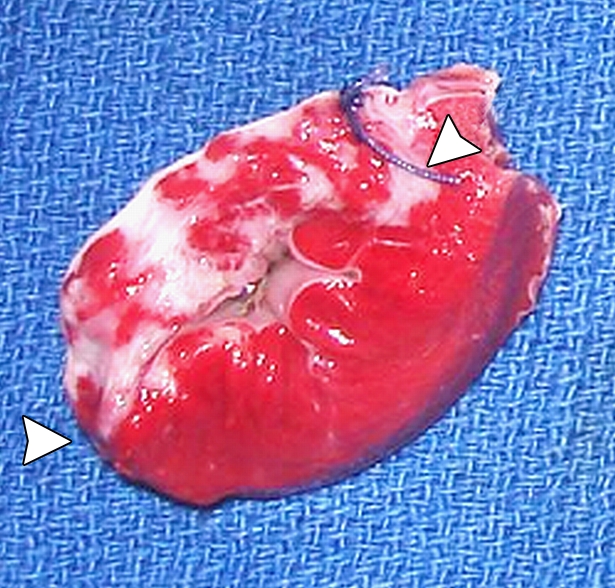
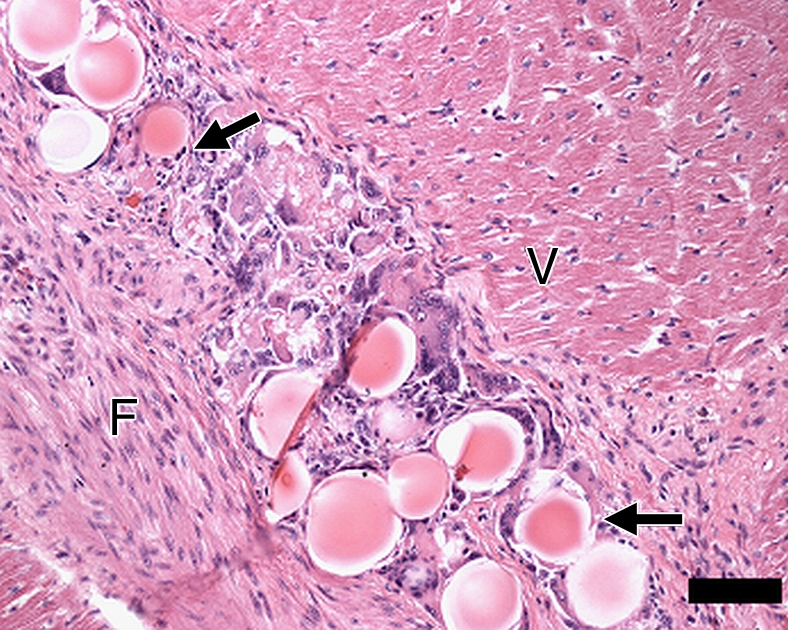
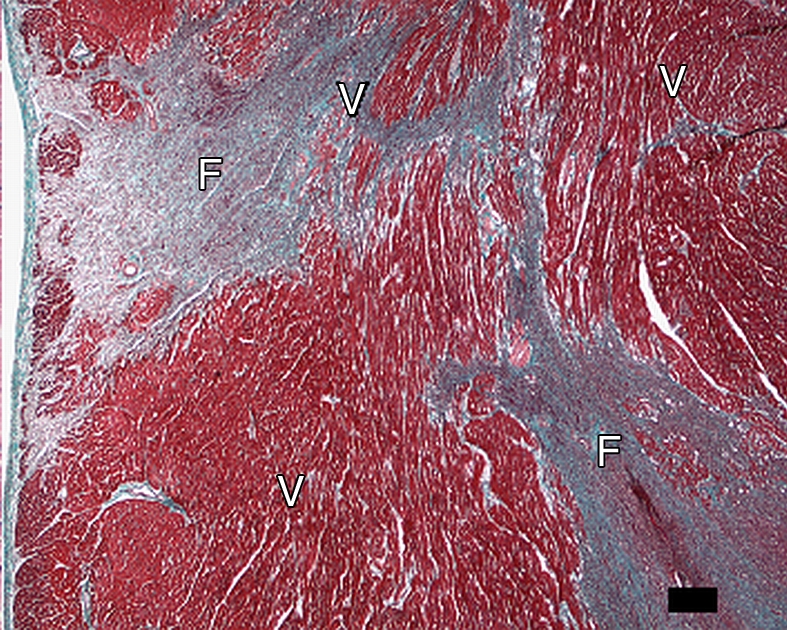
Materials and methods: Approval was obtained from the institutional animal committee. An x-ray/MR system was used to catheterize the left anterior descending (LAD) coronary artery with x-ray guidance and to delineate the perfusion territory. The vessel was selectively microembolized in six pigs with small-diameter embolic material (40-120 microm, 250000 count). At 7-8 weeks after microembolization, multidetector CT and MR imaging were used to assess LV function, first-pass perfusion, and delayed contrast enhancement in remote myocardium and microinfarct scars. Histochemical staining with triphenyltetrazolium chloride (TTC) was used to confirm and quantify heterogeneous microinfarct scars. The two-tailed Wilcoxon signed rank test was used to detect differences between modalities and myocardial regions.

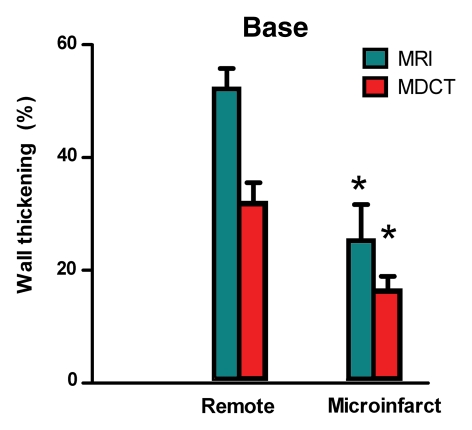
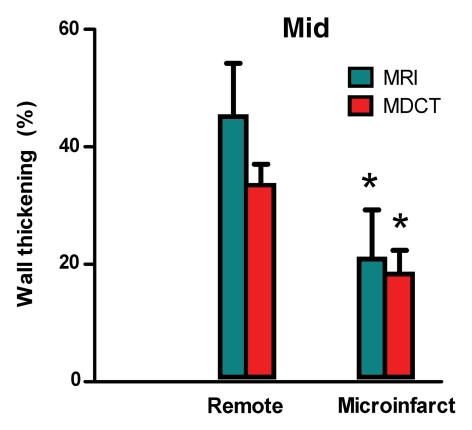
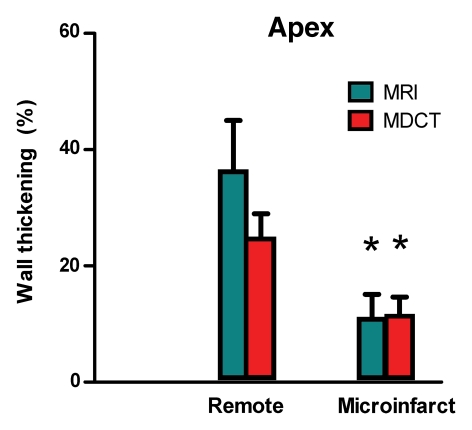
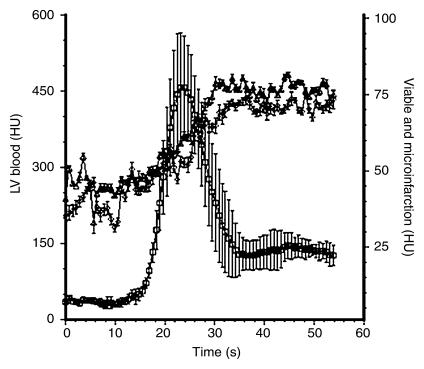
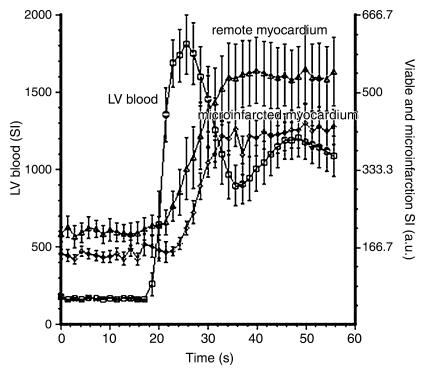
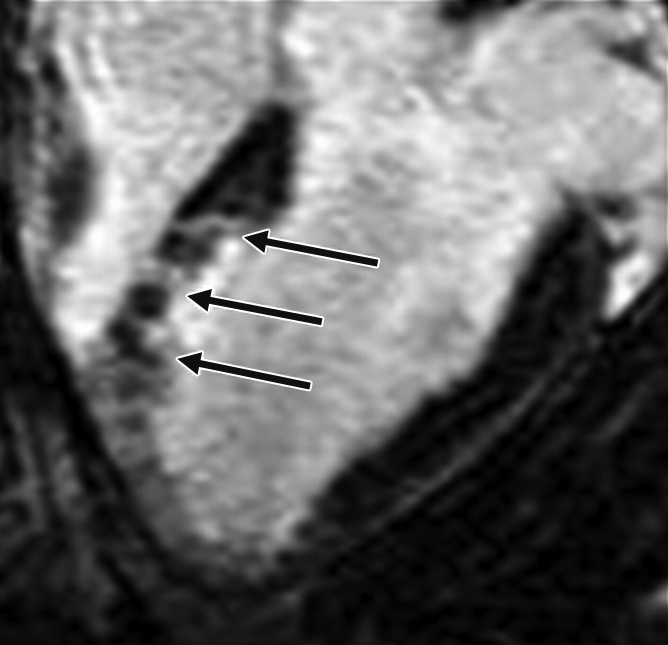
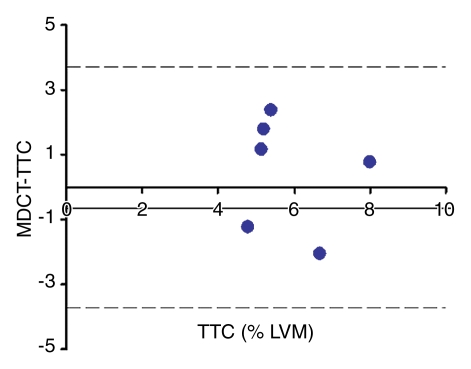
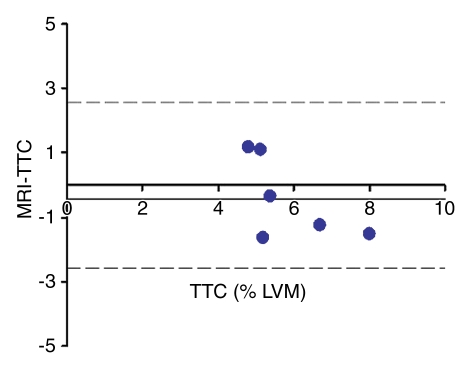
Results: The LAD territory was 32.4% +/- 3.8(stadard error of the mean) of the LV mass. Multidetector CT and MR imaging have similar sensitivity in the detection of regional and global LV dysfunction and extent of microinfarct. The mean LV end-diastolic volume, end-systolic volume, and ejection fraction were 93 mL +/- 8, 46 mL +/- 4, and 50% +/- 3, respectively, on multidetector CT images and 92 mL +/- 8, 48 mL +/- 5, and 48% +/- 3, respectively, on MR images (P > or = .05). The extent of heterogeneous microinfarct was not significantly different between multidetector CT (6.3% +/- 0.8 of the LV mass), MR imaging (6.6% +/- 0.5 of the LV mass), and TTC staining (7.0% +/- 0.6 of the LV mass). First-pass multidetector CT and MR imaging demonstrated significant regional differences (P < .05) in time to peak between the heterogeneous microinfarct and remote myocardium (17.0 seconds +/- 0.3 and 12.4 seconds +/- 0.6, respectively, for multidetector CT and 17.2 seconds +/- 0.8 and 12.5 seconds +/- 1.0, respectively, for MR imaging).

Conclusion: Modern multidetector CT and MR imaging are sensitive modalities with which to depict heterogeneous microinfarcts and determine regional LV dysfunction and decreased perfusion in the territory of intervention. (c) RSNA, 2010.


Figures

Figure 1a:
Figure 1a:
Multisection cine MR images acquired at (a) end-diastolic and (b) end-systolic phases used to measure LV regional and global function. Base = basal, Mid = middle.
Figure 1b:
Figure 1b:
Multisection cine MR images acquired at (a) end-diastolic and (b) end-systolic phases used to measure LV regional and global function. Base = basal, Mid = middle.
Figure 2a:
Figure 2a:
Multidetector contrast-enhanced cine CT images acquired at (a) end-diastolic and (b) end-systolic phases used to measure LV regional and global function. Note that contrast-enhanced multidetector CT images show better definition of LV and right ventricular walls and lack the interphase low signal intensity seen on unenhanced MR images (Fig 1). Base = basal, Mid = middle.
Figure 2b:
Figure 2b:
Multidetector contrast-enhanced cine CT images acquired at (a) end-diastolic and (b) end-systolic phases used to measure LV regional and global function. Note that contrast-enhanced multidetector CT images show better definition of LV and right ventricular walls and lack the interphase low signal intensity seen on unenhanced MR images (Fig 1). Base = basal, Mid = middle.
Figure 3a:
Figure 3a:
Bar graphs show regional systolic wall thickening in (a) basal (Base), (b) middle (Mid), and (c) apical (Apex) sections on MR and multidetector CT (MDCT) images. Lines extending from the bars indicate standard errors of the mean. Note the impairment in systolic wall thickening in the microinfarcted LAD territory compared with remote myocardium 7–8 weeks after embolization with both methods. ∗ = A significant difference (P < .05) was seen when comparing microinfarcted wall thickening with remote myocardium within each section.
Figure 3b:
Figure 3b:
Bar graphs show regional systolic wall thickening in (a) basal (Base), (b) middle (Mid), and (c) apical (Apex) sections on MR and multidetector CT (MDCT) images. Lines extending from the bars indicate standard errors of the mean. Note the impairment in systolic wall thickening in the microinfarcted LAD territory compared with remote myocardium 7–8 weeks after embolization with both methods. ∗ = A significant difference (P < .05) was seen when comparing microinfarcted wall thickening with remote myocardium within each section.
Figure 3c:
Figure 3c:
Bar graphs show regional systolic wall thickening in (a) basal (Base), (b) middle (Mid), and (c) apical (Apex) sections on MR and multidetector CT (MDCT) images. Lines extending from the bars indicate standard errors of the mean. Note the impairment in systolic wall thickening in the microinfarcted LAD territory compared with remote myocardium 7–8 weeks after embolization with both methods. ∗ = A significant difference (P < .05) was seen when comparing microinfarcted wall thickening with remote myocardium within each section.
Figure 4a:
Figure 4a:
Plots show the quantitative analysis of first-pass perfusion on (a) multidetector CT and (b) MR images 7–8 weeks after microembolization. LAD territory with heterogeneous microinfarct scar showed perfusion deficit compared with remote myocardium on both CT and MR images. The results (mean ± standard error of the mean) from the myocardium are shown at a magnified scale for clarity. □ = microinfarct, □ = LV blood pool, □ = remote myocardium.
Figure 4b:
Figure 4b:
Plots show the quantitative analysis of first-pass perfusion on (a) multidetector CT and (b) MR images 7–8 weeks after microembolization. LAD territory with heterogeneous microinfarct scar showed perfusion deficit compared with remote myocardium on both CT and MR images. The results (mean ± standard error of the mean) from the myocardium are shown at a magnified scale for clarity. □ = microinfarct, □ = LV blood pool, □ = remote myocardium.
Figure 5a:
Figure 5a:
(a, b) Short-axis delayed contrast-enhanced (a) multidetector CT and (b) MR images show heterogeneous microinfarct scars as high-attenuation or hyperintense subregions. (c, d) Long-axis views from delayed contrast-enhanced (c) multidetector CT and (d) MR images show high-attenuation or hyperintense stripes (arrows) that represent microinfarcts extending from the epicardium to the endocardium and indicating the path of occluded blood microvessels.
Figure 5b:
Figure 5b:
(a, b) Short-axis delayed contrast-enhanced (a) multidetector CT and (b) MR images show heterogeneous microinfarct scars as high-attenuation or hyperintense subregions. (c, d) Long-axis views from delayed contrast-enhanced (c) multidetector CT and (d) MR images show high-attenuation or hyperintense stripes (arrows) that represent microinfarcts extending from the epicardium to the endocardium and indicating the path of occluded blood microvessels.
Figure 5c:
Figure 5c:
(a, b) Short-axis delayed contrast-enhanced (a) multidetector CT and (b) MR images show heterogeneous microinfarct scars as high-attenuation or hyperintense subregions. (c, d) Long-axis views from delayed contrast-enhanced (c) multidetector CT and (d) MR images show high-attenuation or hyperintense stripes (arrows) that represent microinfarcts extending from the epicardium to the endocardium and indicating the path of occluded blood microvessels.
Figure 5d:
Figure 5d:
(a, b) Short-axis delayed contrast-enhanced (a) multidetector CT and (b) MR images show heterogeneous microinfarct scars as high-attenuation or hyperintense subregions. (c, d) Long-axis views from delayed contrast-enhanced (c) multidetector CT and (d) MR images show high-attenuation or hyperintense stripes (arrows) that represent microinfarcts extending from the epicardium to the endocardium and indicating the path of occluded blood microvessels.
Figure 6a:
Figure 6a:
Bland-Altman plots show the agreement of microinfarct size measured on (a) multidetector CT (MDCT-TTC) and (b) MR (MRI-TTC) images compared with that measured with TTC staining. All microinfarct measurements were expresssed as a percentage of left ventricular mass (% LVM). Thin lines indicate the mean difference between the methods. Dashed lines indicate the limits of agreement, namely, two standard deviations of the difference between the measurements. Circles indicate the difference for each animal.
Figure 6b:
Figure 6b:
Bland-Altman plots show the agreement of microinfarct size measured on (a) multidetector CT (MDCT-TTC) and (b) MR (MRI-TTC) images compared with that measured with TTC staining. All microinfarct measurements were expresssed as a percentage of left ventricular mass (% LVM). Thin lines indicate the mean difference between the methods. Dashed lines indicate the limits of agreement, namely, two standard deviations of the difference between the measurements. Circles indicate the difference for each animal.
Figure 7a:
Figure 7a:
(a, b) Histochemical and (c, d) histopathologic staining show the transmural distribution of heterogeneous microinfarct scar. Arrowheads indicate the extent of LAD territory where heterogeneous microinfarct was detected. In c, the embolic material (arrows) is trapped in the core of scar tissue. (Hematoxylin-eosin stain; original magnification, ×100.) In d, we confirmed the presence of stripes that extend from the epicardium to the endocardium, indicating the path of occluded blood vessels. (Masson trichrome stain; original magnification, ×40.) F = tongues of fibrous tissue, V = viable myocardium.
Figure 7b:
Figure 7b:
(a, b) Histochemical and (c, d) histopathologic staining show the transmural distribution of heterogeneous microinfarct scar. Arrowheads indicate the extent of LAD territory where heterogeneous microinfarct was detected. In c, the embolic material (arrows) is trapped in the core of scar tissue. (Hematoxylin-eosin stain; original magnification, ×100.) In d, we confirmed the presence of stripes that extend from the epicardium to the endocardium, indicating the path of occluded blood vessels. (Masson trichrome stain; original magnification, ×40.) F = tongues of fibrous tissue, V = viable myocardium.
Figure 7c:
Figure 7c:
(a, b) Histochemical and (c, d) histopathologic staining show the transmural distribution of heterogeneous microinfarct scar. Arrowheads indicate the extent of LAD territory where heterogeneous microinfarct was detected. In c, the embolic material (arrows) is trapped in the core of scar tissue. (Hematoxylin-eosin stain; original magnification, ×100.) In d, we confirmed the presence of stripes that extend from the epicardium to the endocardium, indicating the path of occluded blood vessels. (Masson trichrome stain; original magnification, ×40.) F = tongues of fibrous tissue, V = viable myocardium.
Figure 7d:
Figure 7d:
(a, b) Histochemical and (c, d) histopathologic staining show the transmural distribution of heterogeneous microinfarct scar. Arrowheads indicate the extent of LAD territory where heterogeneous microinfarct was detected. In c, the embolic material (arrows) is trapped in the core of scar tissue. (Hematoxylin-eosin stain; original magnification, ×100.) In d, we confirmed the presence of stripes that extend from the epicardium to the endocardium, indicating the path of occluded blood vessels. (Masson trichrome stain; original magnification, ×40.) F = tongues of fibrous tissue, V = viable myocardium.

Comment in

Similar articles

Cited by

References

    1. Anderson JL, Adams CD, Antman EM, et al. ACC/AHA 2007 guidelines for the management of patients with unstable angina/non-ST-elevation myocardial infarction: a report of the American College of Cardiology/American Heart Association Task Force on Practice Guidelines (Writing Committee to Revise the 2002 Guidelines for the Management of Patients With Unstable Angina/Non-ST-Elevation Myocardial Infarction) developed in collaboration with the American College of Emergency Physicians, the Society for Cardiovascular Angiography and Interventions, and the Society of Thoracic Surgeons endorsed by the American Association of Cardiovascular and Pulmonary Rehabilitation and the Society for Academic Emergency Medicine. J Am Coll Cardiol 2007;50:e1–e157 - PubMed
    1. Porto I, Selvanayagam JB, Van Gaal WJ, et al. Plaque volume and occurrence and location of periprocedural myocardial necrosis after percutaneous coronary intervention: insights from delayed-enhancement magnetic resonance imaging, thrombolysis in myocardial infarction myocardial perfusion grade analysis, and intravascular ultrasound. Circulation 2006;114:662–669 - PubMed
    1. Erbel R. Spontaneous and interventionalcoronary microembolisation. Heart 2003;89:986–989 - PMC - PubMed
    1. Falk E. Unstable angina with fatal outcome: dynamic coronary thrombosis leading to infarction and/or sudden death: autopsy evidence of recurrent mural thrombosis with peripheral embolization culminating in total vascular occlusion. Circulation 1985;71:699–708 - PubMed
    1. Selvanayagam JB, Cheng AS, Jerosch-Herold M, et al. Effect of distal embolization on myocardial perfusion reserve after percutaneous coronary intervention: a quantitative magnetic resonance perfusion study. Circulation 2007;116:1458–1464 - PubMed

Publication types

MeSH terms