

Comment
doi: 10.1038/nn0310-271.
Changing tune in auditory cortex
- PMID: 20177415
- PMCID: PMC2989898
- DOI: 10.1038/nn0310-271
Item in Clipboard
Comment
Changing tune in auditory cortex
Nat Neurosci.
2010 Mar.
Abstract
Investigating the organization of tone representation in the rodent auditory cortex at high resolution, two new studies in this issue find that the arrangement of relative frequency responsiveness is not preserved at a fine-scale cortical level.
Conflict of interest statement
The authors declare no competing financial interests.
Figures
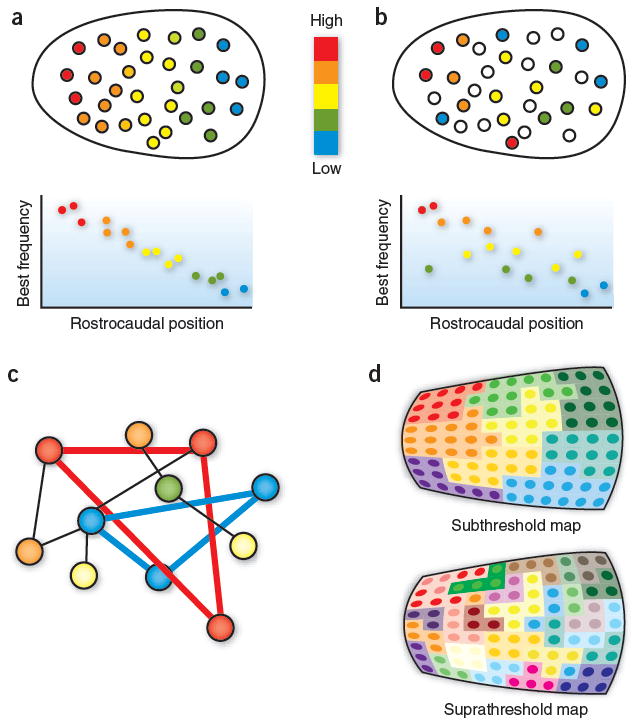
Tonotopy and network architecture in primary auditory cortex (A1). (a) Schematic of the classical tonotopic map. There is a smooth increase in the preferred frequency (best frequency, indicated by color) of neurons along the rostrocaudal axis. (b) Tonotopic organization of A1 was derived from two-photon imaging,. Tonotopy is present on a large scale overall, but is not maintained on a local scale. Neurons with widely varying best frequencies are often located next to each other, giving rise to a fractured map. Many neurons (open circles) show no clear best frequency or are unresponsive to simple acoustic stimuli. (c) Similarly tuned neurons in A1 form functional subnetworks that are defined by their similar frequency-tuning characteristics. Thick lines connecting similarly tuned neurons indicate substantial coactivation, possibly reflecting common thalamic inputs and/or selective interconnections. (d) Fragmentation of clustered input maps into fractured output maps as revealed by imaging with high- and low-affinity calcium indicators.
Comment on
-
Dichotomy of functional organization in the mouse auditory cortex.Nat Neurosci. 2010 Mar;13(3):361-8. doi: 10.1038/nn.2490. Epub 2010 Jan 31. Nat Neurosci. 2010. PMID: 20118924 Free PMC article.
-
Functional organization and population dynamics in the mouse primary auditory cortex.Nat Neurosci. 2010 Mar;13(3):353-60. doi: 10.1038/nn.2484. Epub 2010 Jan 31. Nat Neurosci. 2010. PMID: 20118927
References
Publication types
MeSH terms
Grants and funding
LinkOut - more resources
Full Text Sources
