. 2010 Jun;28(3):405-24.
doi: 10.1007/s10827-010-0224-9. Epub 2010 Feb 23.

Encoding and decoding amplitude-modulated cochlear implant stimuli--a point process analysis

Affiliations

Encoding and decoding amplitude-modulated cochlear implant stimuli--a point process analysis

Joshua H Goldwyn et al. J Comput Neurosci. 2010 Jun.

Abstract

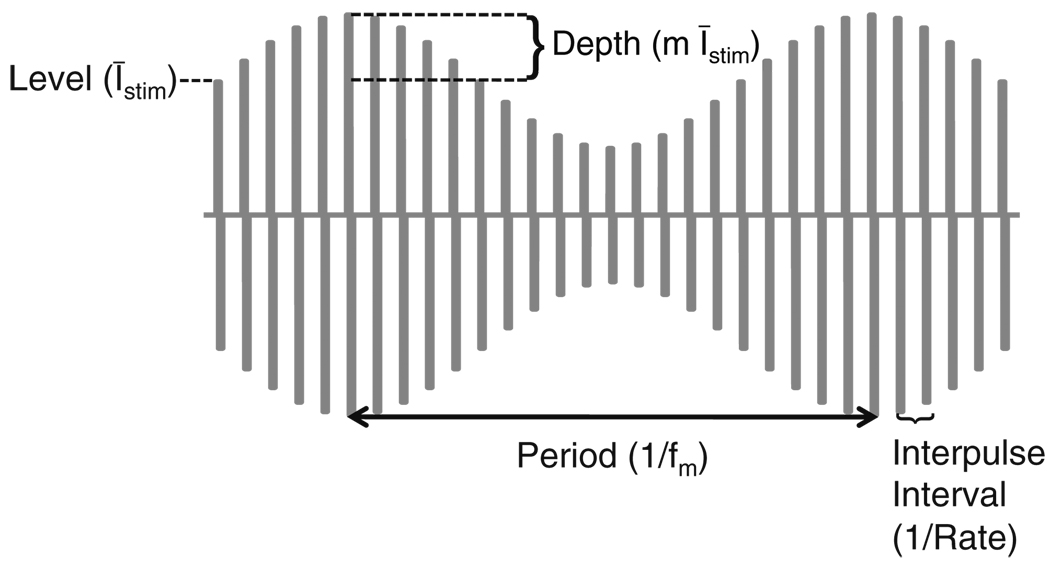
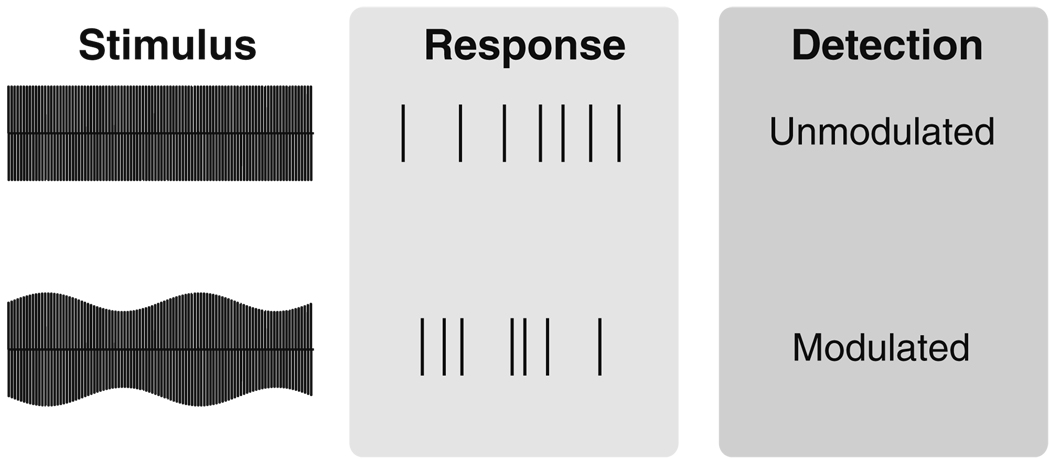
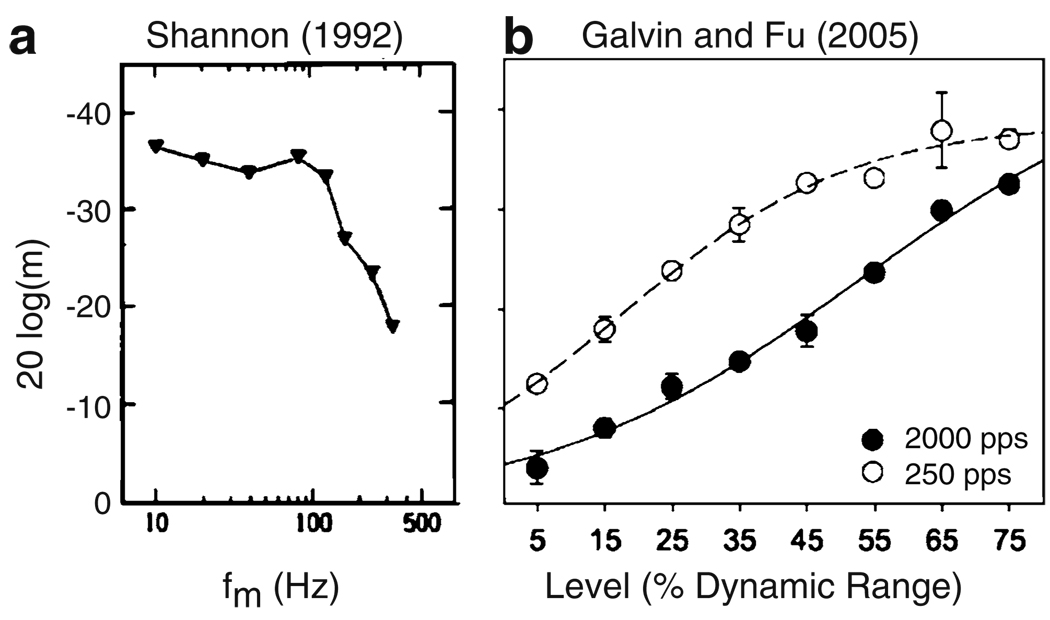
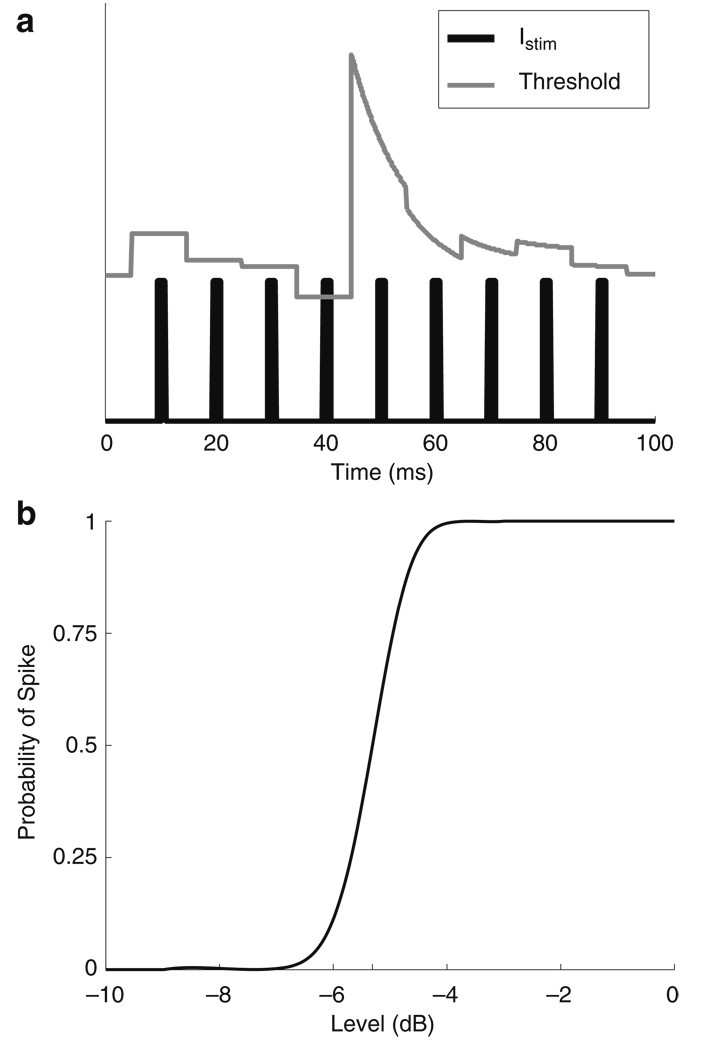
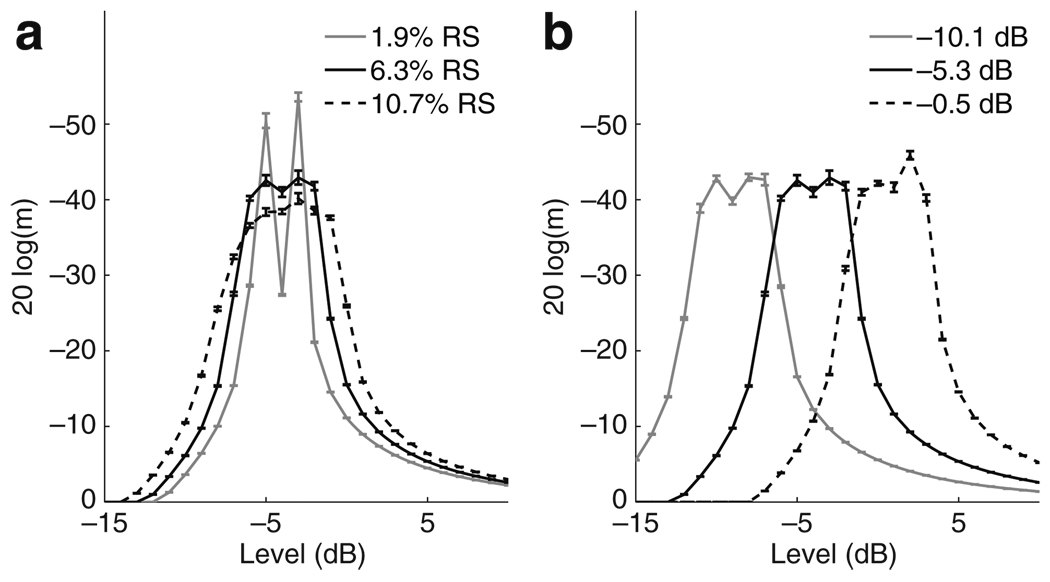
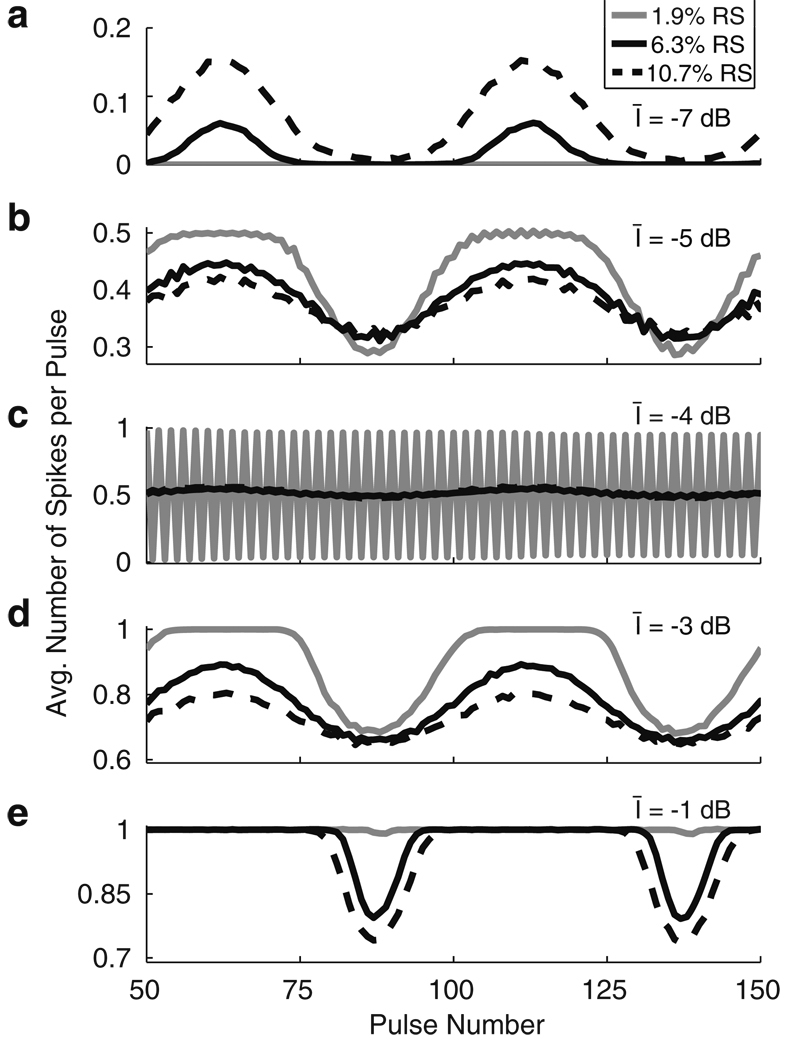
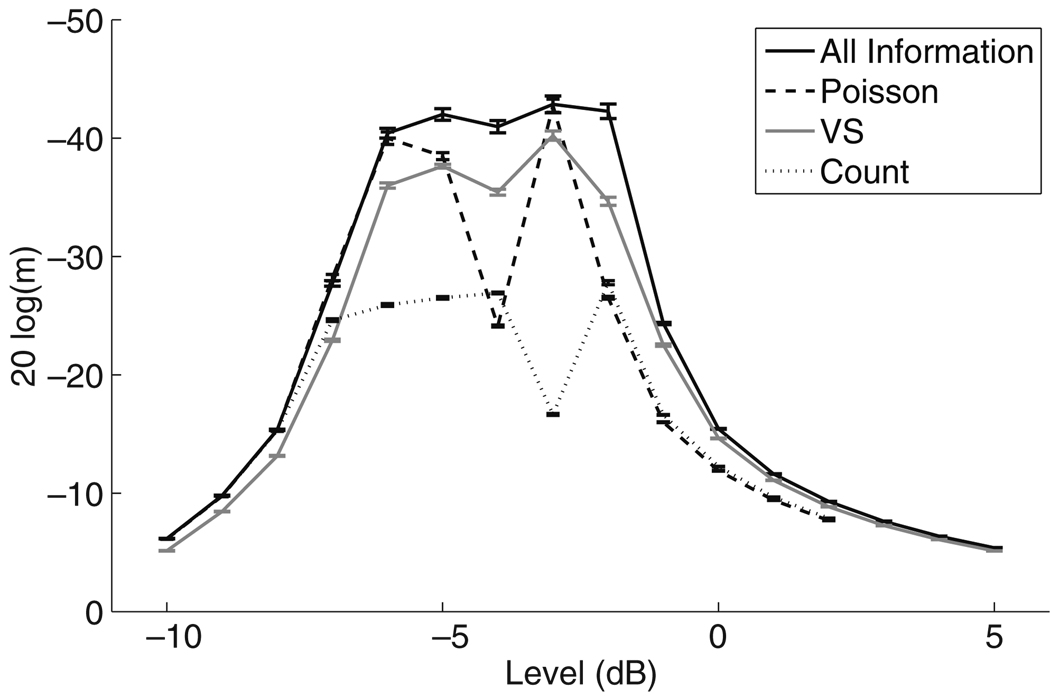
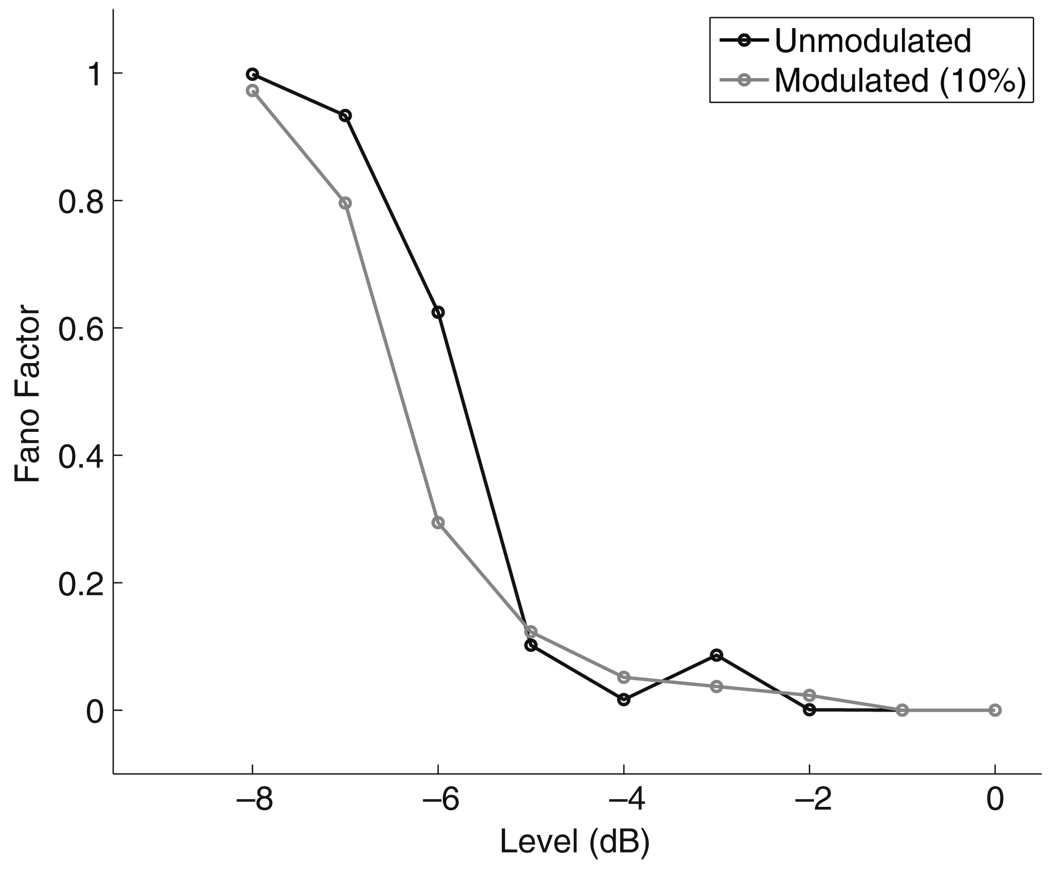
Cochlear implant speech processors stimulate the auditory nerve by delivering amplitude-modulated electrical pulse trains to intracochlear electrodes. Studying how auditory nerve cells encode modulation information is of fundamental importance, therefore, to understanding cochlear implant function and improving speech perception in cochlear implant users. In this paper, we analyze simulated responses of the auditory nerve to amplitude-modulated cochlear implant stimuli using a point process model. First, we quantify the information encoded in the spike trains by testing an ideal observer's ability to detect amplitude modulation in a two-alternative forced-choice task. We vary the amount of information available to the observer to probe how spike timing and averaged firing rate encode modulation. Second, we construct a neural decoding method that predicts several qualitative trends observed in psychophysical tests of amplitude modulation detection in cochlear implant listeners. We find that modulation information is primarily available in the sequence of spike times. The performance of an ideal observer, however, is inconsistent with observed trends in psychophysical data. Using a neural decoding method that jitters spike times to degrade its temporal resolution and then computes a common measure of phase locking from spike trains of a heterogeneous population of model nerve cells, we predict the correct qualitative dependence of modulation detection thresholds on modulation frequency and stimulus level. The decoder does not predict the observed loss of modulation sensitivity at high carrier pulse rates, but this framework can be applied to future models that better represent auditory nerve responses to high carrier pulse rate stimuli. The supplemental material of this article contains the article's data in an active, re-usable format.


Figures

Fig. 1
Fig. 1
Current delivered to CI electrode is AM train of biphasic rectangular pulses. AM pulse trains are parameterized by the average pulse level (Īstim), carrier pulse rate, modulation depth (m), and modulation frequency (fm). The intensity of each pulse is given in Eq. (1)
Fig. 2
Fig. 2
Method for simulating AM detection in a two-alternative forced-choice task with a computational model of the AN. Un-modulated and modulated stimuli are used as inputs to the AN model. An ideal observer then attempts to perform the detection task based on information in the simulated AN spike trains
Fig. 3
Fig. 3
Example of data from two CI listeners that illustrate the key qualitative trends in MDTs that will be modeled. Ordinate is MDT presented with a logarithmic scale. More negative values of 20 log(m) (i.e. higher on the y-axis) correspond to smaller MDTs (i.e. better performance on the detection task). a Subject N2 in Shannon (1992). The abscissa is modulation frequency. The key qualitative trend in these data are that MDTs increase at high modulation frequencies (above 100 Hz for this subject). Reprinted with permission from Shannon (1992). Copyright 1992, Acoustical Society of America. b Subject S1 in Galvin and Fu (2005). The abscissa is stimulus level and two curves are shown to represent results for a low carrier pulse rate (dashed line) and a high carrier pulse rate (black line). The key qualitative trends in these data are that MDTs decrease with level and are higher (i.e. worse performance on the detection task) when the stimuli are presented with a high carrier pulse rate. Reprinted with permission from Galvin and Fu (2005). Copyright 2005, Association for Research in Otolaryngology
Fig. 4
Fig. 4
a The AN model introduced by Bruce et al. (1999a, b) is a stochastic threshold crossing model. The stimulus level of each pulse (Istim, black line) is compared to the threshold level (gray line). The model generates a spike if the stimulus level exceeds the threshold. The threshold is stochastic due to an additive Gaussian noise term applied at each pulse. In this example, the threshold is crossed at the fourth pulse. The threshold is temporarily elevated immediately after a spike and relaxes back to baseline level due to the refractory effect. b The probability that an isolated pulse will elicit a neural spike depends on the stimulus level and is defined in Eq. (2). This function is referred to as the firing efficiency curve and has a sigmoidal shape due to the additive Gaussian noise term
Fig. 5
Fig. 5
Effect of neural parameters on AM encoding. MDTs are computed from the mean of 10 runs of the stochastic approximation algorithm and error bars represent the standard error of the mean. MDTs are plotted against mean stimulus level. a Varying RS: mean (black line), low (gray line), and high (dotted line) RS values are chosen according to data reported by Miller et al. (1999). MDTs improve near threshold as RS decreases, but the range of levels over which the model neuron can effectively encode AM also decreases with decreasing RS. b Varying neural threshold: mean (black line), low (gray line), and high (dotted line) neural threshold values are chosen according to data reported by Miller et al. (1999). The primary effect of changing the threshold value is to shift the range of stimulus levels over which the model neuron can effectively encode modulation
Fig. 6
Fig. 6
Illustration of the effect of changing RS values on coding. The abscissa is the pulse number and the ordinate is the probability of observing a spike in response to that pulse, obtained by averaging over 1,000 repeated simulations of the model in response to modulated stimuli. Modulation depth is −30 dB modulation depth (m ≈ 3%) for all simulations except Panel E. Modulation depth in Panel E is 20% so that differences between RS values are visible. RS values are the same as Fig. 5. a Īstim = −7 dB. Higher RS improves encoding at low stimulus levels by increasing the number of spikes at the peak of the modulated stimulus. b Īstim = −5 dB. Lower RS values improve encoding by increasing the number of spikes at the peaks of the modulated stimulus. c Īstim = −4 dB. The neuron fires to every other pulse in a nearly deterministic fashion for low RS values. High RS values break this pattern and allows for greater discriminability between modulated and unmodulated stimuli. d Īstim = −3 dB. Lower RS values improve encoding by increasing the number of spikes at the peaks of the modulated stimulus. e Īstim = −1 dB. Higher RS improves encoding at high stimulus levels by decreasing the number of spikes during the troughs of the modulated stimulus
Fig. 7
Fig. 7
MDTs as a function of level computed for a single model neuron using the four spike train response variables. Modulation frequency is fm = 20 Hz and carrier pulse rate is 1,000 pps. MDTs are computed from the mean of 10 runs of the stochastic approximation algorithm and error bars represent the standard error of the mean
Fig. 8
Fig. 8
Fano factor as a function of stimulus level for unmodulated (black) and AM (gray) pulse trains. Modulation depth is 10% and modulation frequency is 20 Hz for the AM stimulus. The Fano factor approaches zero as the stimulus level increases beyond −4 dB indicating that the Poisson approximation is not valid at high stimulus levels
Fig. 9
Fig. 9
a Spike count as a function of modulation depth. Error bars are standard deviation of 1,000 repeated simulations of the model. Spike count decreases as modulation depth increases (gray line). b Effective average pulse intensity is defined as the average stimulus level of all pulses in the train excluding those that fall immediately after a spike. Effective average pulse intensity decreases with modulation depth indicating that the dependence of spike count on modulation depth shown in (a) is due to the refractory period
Fig. 10
Fig. 10
MDTs as a function of modulation frequency computed for a single model neuron using the four spike train response variables. Mean stimulus level is Īstim = −5.31 dB and carrier pulse rate is 1,000 pps. MDTs are computed from the mean of 10 runs of the stochastic approximation algorithm and error bars represent the standard error of the mean
Fig. 11
Fig. 11
MDTs as a function of carrier pulse rate computed for a single model AN using the four spike train response variables. Modulation frequency is fm = 20 Hz and mean stimulus level is Īstim = −5.31 dB
Fig. 12
Fig. 12
a Raster plot for 100 repeated simulated responses of a single model neuron to AM stimuli (m = 10%). Left fm = 20 Hz. Right fm = 250 Hz. b Spike times in (a) are jittered by adding random increments drawn from a Gaussian distribution with zero mean and standard deviation σ = 2 ms. c MDTs as a function of fm for varying amounts of jitter (σ) using the VS spike train measure. Increasing σ degrades the temporal resolution of the decoder and results in MDTs that are qualitatively consistent with psychophysical data
Fig. 13
Fig. 13
MDTs as a function of stimulus level and varying the number of model AN cells that are used as inputs to the VS decoder. RS and Ithr are varied according to the distribution of data reported in Miller et al. (1999). A population of 50 model AN cells (gray line) is needed to produce MDTs that monotonically improve over a range of current levels of approximately 10 dB, consistent with typical dynamic ranges in CI users. MDTs are computed from the mean of 10 runs of the stochastic approximation algorithm and error bars represent the standard error of the mean
Fig. 14
Fig. 14
MDTs as a function of stimulus level for 250 pps pulse train (gray line) and 2,000 pps pulse train (black line) for the VS decoder applied to the jittered spike trains of 50 heterogeneous model AN cells. a Abscissa is current level (Īstim) measured in dB relative to 1 mA. b Abscissa is the average number of spikes evoked by the unmodulated stimulus. This provides a proxy for loudness that is used to balance stimulus levels at the two carrier pulse rates. In both cases, MDTs are smaller (better detection) for the high carrier pulse rate. MDTs are computed from the mean of 10 runs of the stochastic approximation algorithm and error bars represent the standard error of the mean
Fig. 15
Fig. 15
Summary of predictions of the VS decoder (compare to Fig. 3). Average number of spikes elicited by unmodulated stimuli are used as a proxy for loudness. a MDTs as a function of fm with stimulus level set so that 500 spikes are elicited by the unmodulated stimulus. This falls in the middle of the range of levels shown in b and therefore serves as a comfortable loud level. The decoder’s performance falls off at high modulation frequency, consistent with the performance of CI users. b MDTs as a function of spike count for 250 pps (gray line) and 2,000 pps (black line) carrier pulse rates. This figure replots Fig. 14(b) in order to emphasize the relation to psychophysical experiments. Stimulus levels for which the unmodulated pulse train does not elicit, on average, one spike are excluded because it is assumed that such levels would be below perceptual threshold. Maximum stimulus levels are set so that the curves are monotonically increasing, consistent with CI psychophysics data

Similar articles

Cited by

References

    1. Briaire J, Frijns J. Field patterns in a 3d tapered spiral model of the electrically stimulated cochlea. Hearing Research. 2000;148:18–30. - PubMed
    1. Bruce IC, Irlicht LS, White MW, O’Leary SJ, Dynes S, Javel E, et al. A stochastic model of the electrically stimulated auditory nerve: Pulse-train response. IEEE Transactions on Biomedical Engineering. 1999a;46(6):630–637. - PubMed
    1. Bruce IC, White MW, Irlicht L, O’Leary SJ, Clark GM. The effects of stochastic neural activity in a model predicting intensity perception with cochlear implants: Low-rate stimulation. IEEE Transactions on Biomedical Engineering. 1999b;46(12):1393–1404. - PubMed
    1. Bruce IC, White MW, Irlicht LS, O’Leary SJ, Dynes S, Javel E, et al. A stochastic model of the electrically stimulated auditory nerve: Single-pulse response. IEEE Transactions on Biomedical Engineering. 1999c;46(6):617–629. - PubMed
    1. Bruce IC, Irlicht LS, White MW, O’Leary SJ, Clark GM. Renewal-process approximation of a stochastic threshold model for electrical neural stimulation. Journal of Comparative Neurology. 2000;9(2):119–132. - PubMed

Publication types