. 2010 Apr;28(4):649-60.
doi: 10.1002/stem.324.

Complex display of putative tumor stem cell markers in the NCI60 tumor cell line panel

Affiliations

Complex display of putative tumor stem cell markers in the NCI60 tumor cell line panel

Christina H Stuelten et al. Stem Cells. 2010 Apr.

Abstract

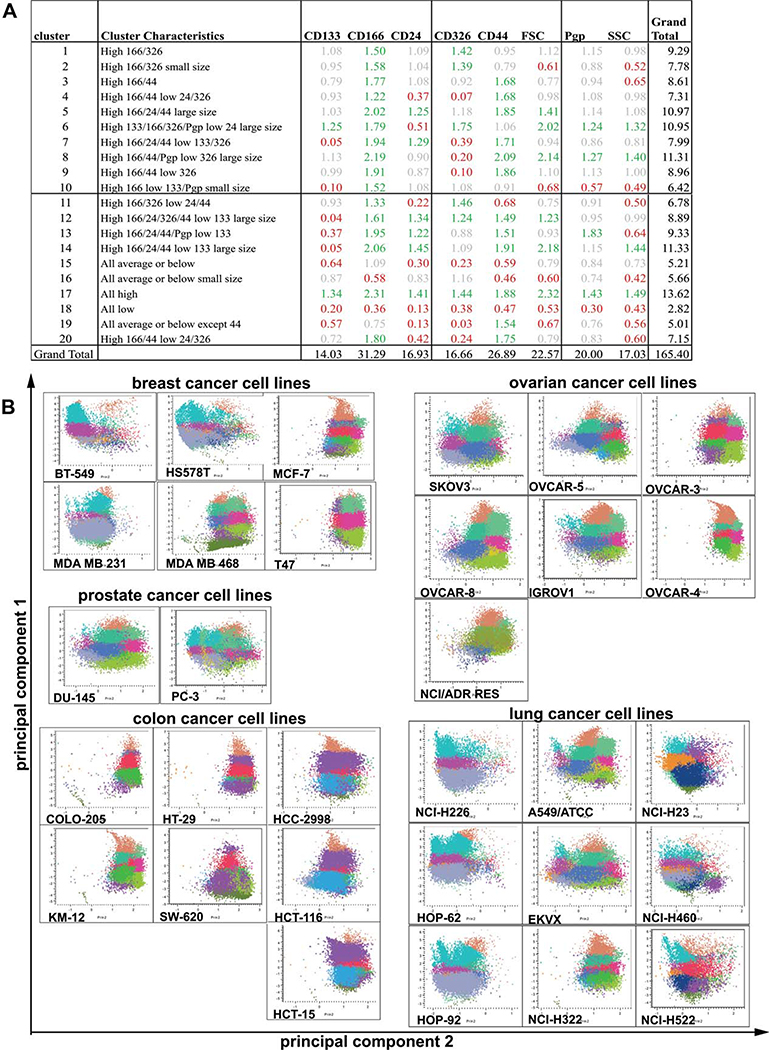
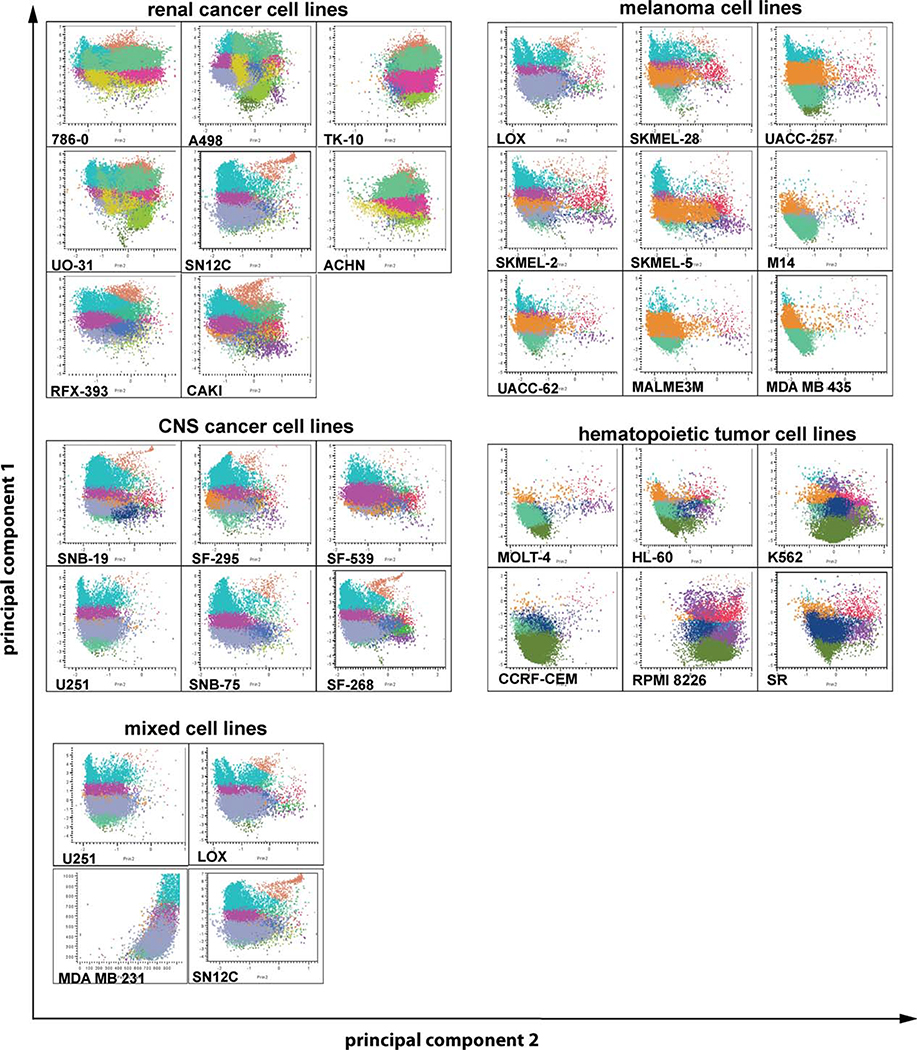
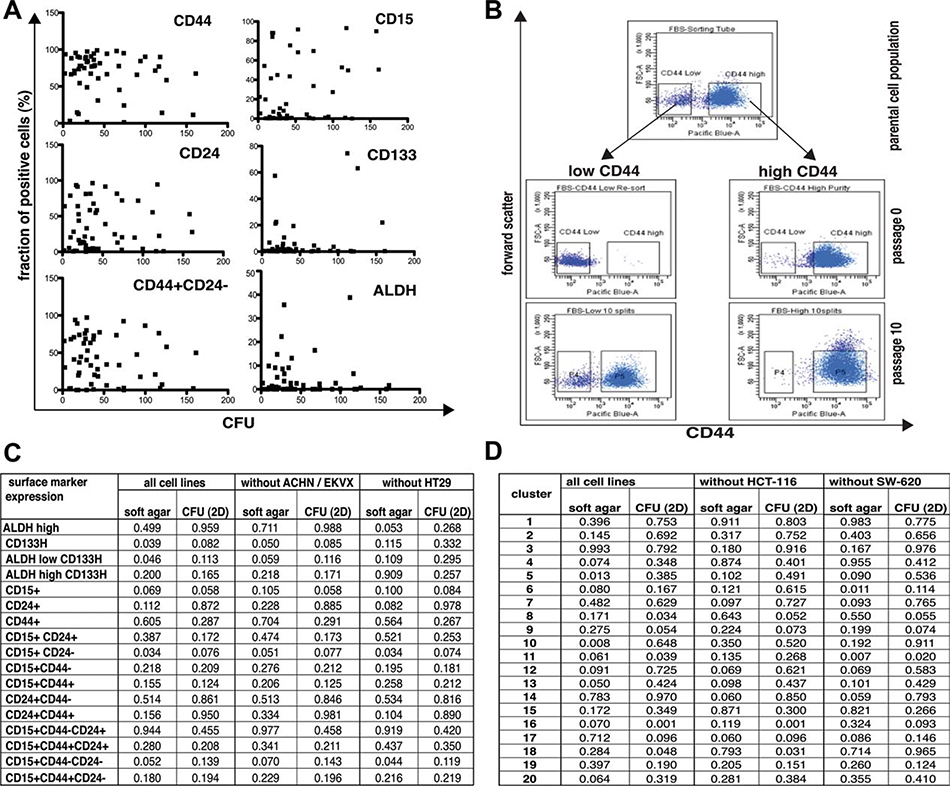
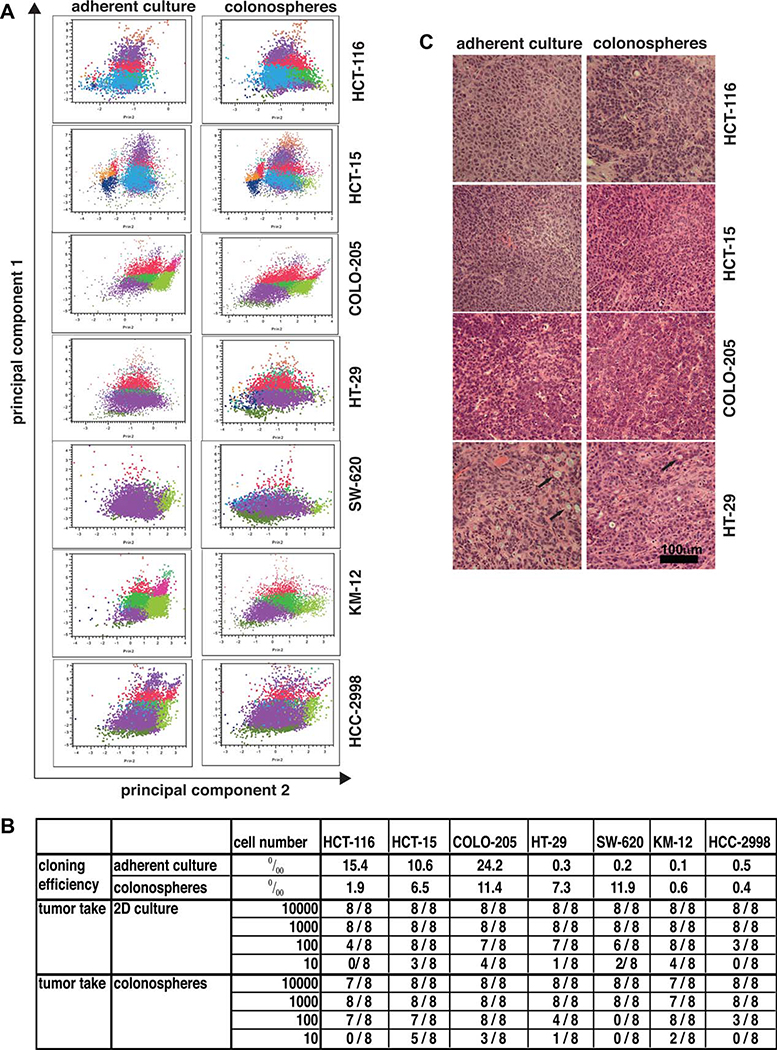
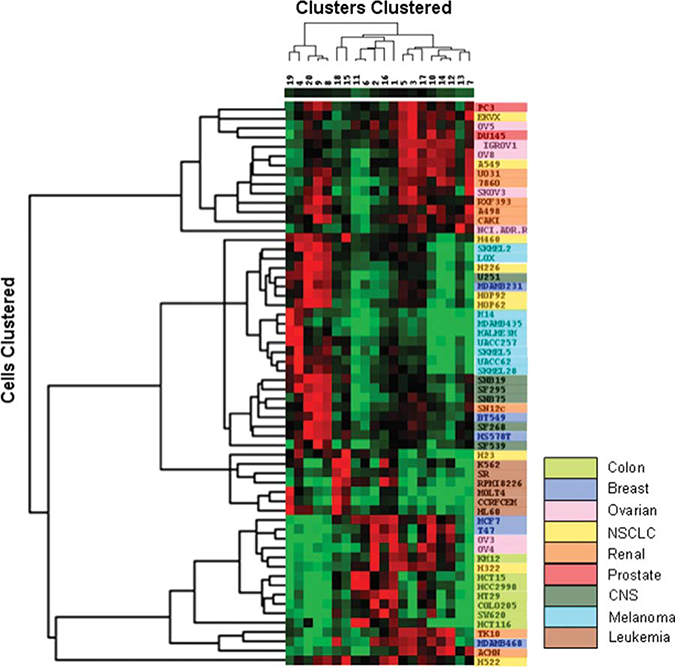
Tumor stem cells or cancer initiating cells (CICs) are single tumor cells that can regenerate a tumor or a metastasis. The identification and isolation of CICs remain challenging, and a variety of putative CIC markers have been described. We hypothesized that cell lines of the NCI60 panel contain CICs and express putative CIC markers. We investigated expression of putative CIC surface markers (CD15, CD24, CD44, CD133, CD166, CD326, PgP) and the activity of aldehyde dehydrogenase in the NCI60 panel singly and in combination by six-color fluorescence-activated cell sorting analysis. All investigated markers were expressed in cell lines of the NCI60 panel. Expression levels of individual markers varied widely across the 60 cell lines, and neither single marker expression nor simple combinations nor co-expression patterns correlated with the colony-formation capacity of cell lines. Rather, marker expression patterns correlated with tumor types in multidimensional analysis. Whereas some expression patterns correlated with tumor entities such as basal breast cancer, other expression patterns occurred across different tumor types and largely related to expression of a more mesenchymal phenotype in individual breast, lung, renal, and melanoma cell lines. Our data for the first time demonstrate that tumor cell lines display CIC markers in a complex pattern that relates to the tumor type. The complexity and tumor type specificity of marker display creates challenges for the application of cell sorting and other approaches to isolation of putative tumor stem cell populations and suggests that therapeutic targeting strategies will need to take this into account.


Conflict of interest statement

Disclosure of Potential Conflicts of Interest

The authors indicate no potential conflicts of interest.

Disclosure of potential conflicts of interest is found at the end of this article.

Figures

Figure 1.
Figure 1.
(A): Cluster mean characteristics expressed as a ratio to the population means. Data from the six-color analysis was subjected to k-means clustering and principal component analysis using JMP-7 (SAS Institute, Research Triangle, NC, http://www.sas.com). For each cell, six fluorescence intensity measurements as well as forward- and side-scatter data were utilized. For each cell line, at least two staining/analysis runs were included in the analysis. Cluster characteristics are tabulated as ratio of the cluster mean to the overall average. Thus, ratios > 1 indicate values higher than the overall average and ratios < 1 indicate lower values. Color coding: green >1.5; gray 1.5–0.7; red <0.7. (B): Cluster pattern of breast, prostate, ovarian, colon, and lung cancer cell lines. Data were analyzed using k-means clustering, and the resulting clusters were color-coded. Plots were generated using the first two principal components and grouped by tumor type. Correlation between cluster patterns was analyzed for each tumor type using JMP-7. Breast cancer cell lines are organized to illustrate the partitioning of stem cell marker co-expression with the molecular taxonomy of breast cancer. Cell lines BT549, HS578T, and MDA-MB-231 fall into the “normal-like” category; cell lines MCF-7 and T47 are “luminal type”, and MDA-MB-468 is “basal type”.
Figure 2.
Figure 2.
Cluster pattern of renal cancer, melanoma, CNS cancer, and hematopoietic tumor cell lines. Data were analyzed using hierarchical k-means clustering, and the resulting 20 k-means clusters were color-coded. Plots were generated using the first two principal components and grouped by tumor type. The correlation between cluster patterns was analyzed for each tumor type using JMP-7 (SAS Institute, Research Triangle, NC, http://www.sas.com). The bottom panel shows cell lines from different tumor types (U251, CNS cancer; LOX, melanoma; MDAMB231, breast cancer; SN12C, renal cancer) that have related cluster patterns. Abbreviations: CNS, central nervous system.
Figure 3.
Figure 3.
Expression of putative tumor stem cell markers does not correlate with colony-forming capacity of cell lines. (A): Expression of CD44, CD24, CD15, CD133, and ALDH does not correlate with colony-forming capacity in 2D adherent culture. Expression levels of CD15, CD24, CD44, CD133, and ALDH activity were analyzed by fluorescence-activated cell sorting (FACS) analysis (50,000 cells/sample) and the size of marker positive and marker negative populations was determined using FlowJo (Treestar Inc., Ashland, OR, http://www.treestar.com). To determine colony-forming units in cell lines, 100 cells were cultured in 100 mm tissue culture plates for 2 weeks, cell colonies were stained with Coomassie Brilliant Blue, and the number of visible colonies was determined. Data are presented as the average of three independent experiments. Scatter plots were generated using Graphpad Prism 5.0b. (B): CD44- (“low CD44”) OVCAR-5 cells generate CD44+ (“high CD44”) cells, while CD44+ OVCAR-5 cells do not generate CD44- cells. OVCAR-5 cells that were grown under adherent culture conditions were FACS sorted into CD44- and CD44+ subpopulations, controlled for purity of the population by FACS analysis of an aliquot, and cultured in 2D adherent culture for 10 passages before expression of CD44 was re-analyzed by FACS. (C): Co-expression of CD133/ALDH and CD24/CD44/CD15 does not correlate with colony-forming potential of cell lines in 2D adherent culture or anchorage-independent soft agar assays. Data acquisition was performed as described above. Additionally, 5,000 cells were embedded in soft agar and colonies counted after 7 days. Data were analyzed for all cell lines (“all cell lines”) or after ACHN/EKVX or HT29 cells that appeared to be outliers in the graphs were excluded to test robustness of the dataset. Linear regressions were performed using GraphPad Prism 5.0b, and p-values are listed. (D): Cluster patterns of surface markers do not correlate with colony-forming potential of cell lines in 2D adherent culture or anchorage-independent soft agar assays. Data acquisition was performed as described above. Additionally, 5,000 cells were embedded in soft agar and colonies were counted after 7 days. Data were analyzed for all cell lines (“all cell lines”) or after HCT-116 or SW-620 cells that appeared to be outliers in the graphs were excluded to test robustness of the dataset. Linear regressions were performed using GraphPad Prism 5.0b, and p-values are listed.
Figure 4.
Figure 4.
Anchorage-independent growth of tumor cell lines alters surface marker expression and tumorigenicity of colon cancer cell lines. Colon cell lines that were grown in 2D adherent cultures or anchorage-independent as colonospheres were brought into single-cell suspension, and were analyzed by multidimensional FACS analysis, by colony formation assays (soft agar), or were injected subcutaneously injected into NOD/SCID mice. (A): Cluster pattern of colon cell lines grown in adherent culture or anchorage-independent as colonospheres. Cells were brought into single-cell suspension, and six-color fluorescence-activated cell sorting analysis was performed. The correlation between cluster patterns was analyzed for each tumor type using JMP-7 (SAS Institute, Research Triangle, NC, http://www.sas.com). Please note that the color coding of the clusters is not identical with the color coding in Figure 3. (B): Influence of culture conditions on colony-forming capacity and tumor-forming capacity of colon cancer cell lines. Colon cell lines that were grown in 2D adherent cultures or anchorage-independent as colonospheres were brought into single-cell suspension and either used for soft agar assays (data present the average of three independent experiments), or the cell number indicated in the table was injected subcutaneously into NOD/SCID mice and animals were subsequently observed for tumor growth. (C): In vitro culture conditions of colon cancer cell lines do not influence the histology of xenograft tumors derived from colon cancer cell lines. Histology (H&E staining) of colon xenograft tumors derived from HCT-116, HCT-15, COLO-205, and HT29 showed comparable, relatively undifferentiated carcinomas whether generated from adherent cultures or colonospheres. Mucin producing cells were occasionally observed in HT-29 tumors (arrows).
Figure 5.
Figure 5.
Heat map generated using “Cluster” and “Treeview” (Eisen et al. (1998) PNAS 95:14863). Percentage populations in each of the 20 k-means defined clusters for each of the cell lines were log (natural) transformed (zero values set to 0.001%) and then subjected to hierarchical (average linkage) clustering by cluster and cell line. The dendrogram at the left of the figure defines clusters by cell line and the vertical dimension reflects clustering by k-means cluster. The scale for the heat map ranges from 0 = bright green to maximum = bright red. Cell lines are color coded by tumor panel to facilitate recognition of panel-related associations. Abbreviations: CNS, central nervous system.

References

    1. Visvader JE, Lindeman GJ. Cancer stem cells in solid tumours: Accumulating evidence and unresolved questions. Nat Rev Cancer 2008;8:755–768. - PubMed
    1. Al-Hajj M, Wicha MS, Benito-Hernandez A et al. Prospective identification of tumorigenic breast cancer cells. Proc Natl Acad Sci U S A 2003;100:3983–3988. - PMC - PubMed
    1. Hurt EM, Kawasaki BT, Klarmann GJ et al. CD44+ CD24(−) prostate cells are early cancer progenitor/stem cells that provide a model for patients with poor prognosis. Br J Cancer 2008;98:756–765 - PMC - PubMed
    1. O’Brien CA, Pollett A, Gallinger S et al. A human colon cancer cell capable of initiating tumour growth in immunodefificient mice. Nature 2007;445:106–110. - PubMed
    1. Fang D, Nguyen TK, Leishear K et al. A tumorigenic subpopulation with stem cell properties in melanomas. Cancer Res 2005;65: 9328–9337. - PubMed

Publication types

Substances