. 2011 Mar;15(3):654-67.
doi: 10.1111/j.1582-4934.2010.01039.x.

Alteration of calcium homeostasis in primary preeclamptic syncytiotrophoblasts: effect on calcium exchange in placenta

Affiliations

Alteration of calcium homeostasis in primary preeclamptic syncytiotrophoblasts: effect on calcium exchange in placenta

S Haché et al. J Cell Mol Med. 2011 Mar.

Abstract

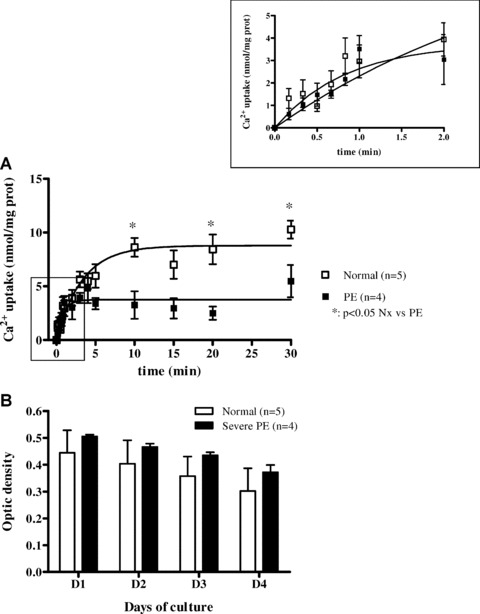
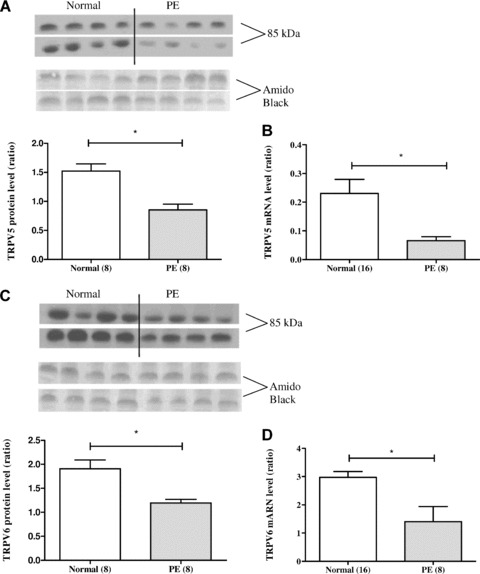
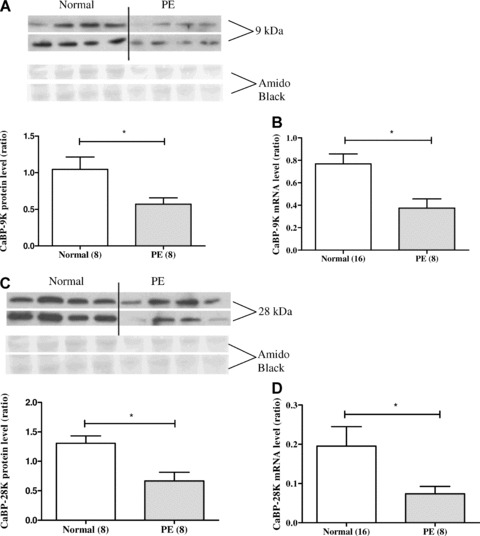
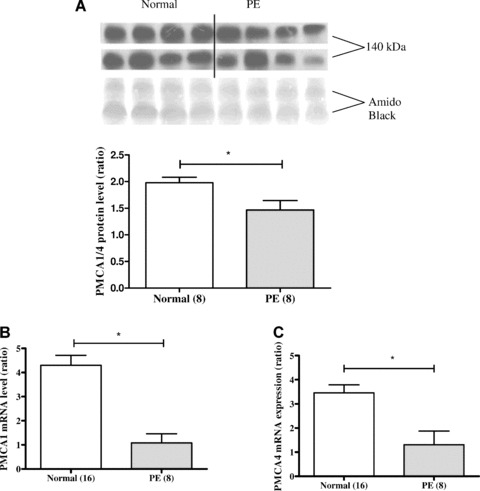
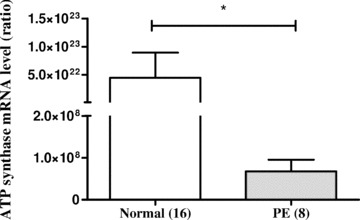
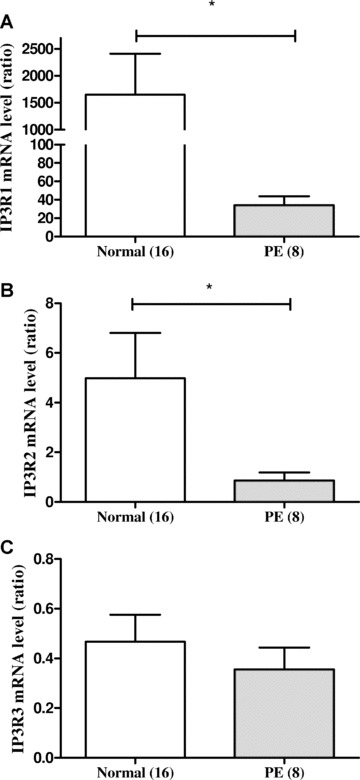
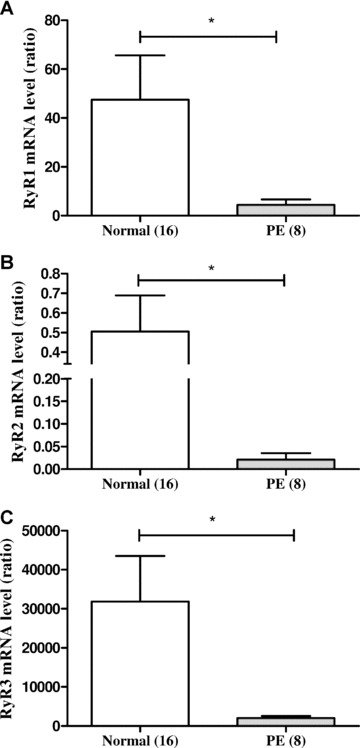
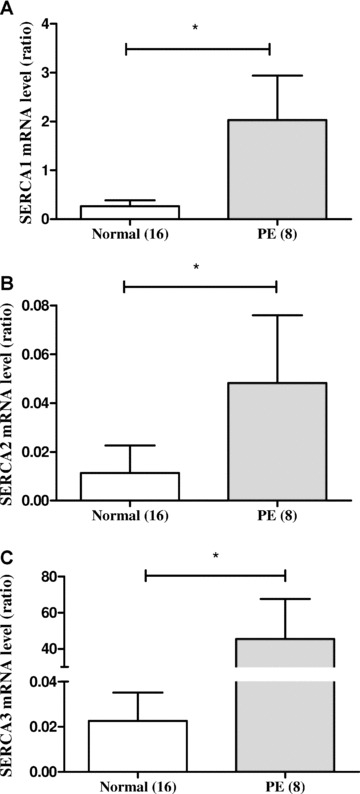
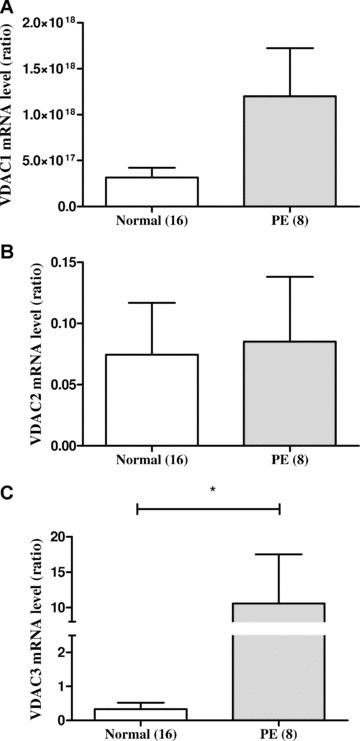
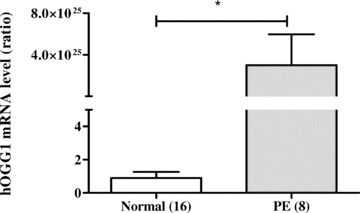
Preeclampsia (PE) is characterized by maternal hypertension, proteinuria, oedema and, in 30% of cases, by intrauterine growth retardation. Causes are still unknown; however, epidemiological and clinical studies have suggested alterations in maternal calcium metabolism. We suggested that in PE, calcium transport by the syncytiotrophoblast (ST) is disturbed. From total placental tissues, we studied the expression of: calcium channels (TRPV5, TRPV6 [transient receptor potential vanilloid]), calcium binding proteins (CaBP-9K, CaBP-28K), plasma membrane calcium ATPase (PMCA)1,2,3,4 pumps, ATP synthase, genes implicated in Ca(2+) release [inositol-1,4,5-triphosphate receptor (IP3R)1,2,3; Ryanodine receptor (RyR)1,2,3] and replenishment (SERCA1,2,3 [sarcoendoplasmic reticulum Ca(2+) ATPases]) from endoplasmic reticulum, channels implicated in mitochondrial Ca(2+) accumulation (VDAC1,2,3 [voltage-dependent anion channels]) and a marker of oxidative stress (hOGG1 [Human 8-oxoguanine-DNA glycosylase 1]), as well as the influence of these variations on calcium transport in primary ST cultures. The mRNA and protein levels were thereby examined by real-time PCR and Western blot analysis, respectively, in two different groups of pregnant women with similar gestational age: a normal group (n= 16) and a PE group (n= 8), diagnosed by a clinician. Our study showed a significant decrease in calcium transport by the ST cultured from preeclamptic placentas. We found a significant (P < 0.05) decrease in mRNA levels of TRPV5, TRPV6, CaBP-9K, CaBP-28K, PMCA1, PMCA4, ATP synthase, IP3R1, IP3R2, RyR1, RyR2 and RyR3 in PE group compared to normal one. We also noted a significant decrease in protein levels of TRPV5, TRPV6, CaBP-9K, CaBP-28K and PMCA1/4 in PE group. In contrast, SERCA1, SERCA2, SERCA3, VDAC3 and hOGG1 mRNA expressions were significantly increased in PE placentas. Calcium homeostasis and transport through placenta is compromised in preeclamptic pregnancies and it appears to be affected by a lack of ATP and an excess of oxidative stress.


Figures

Fig 1
Fig 1
The calcium transport decreased in trophoblasts coming from PE placentas. (A) This calcium transport analysis was performed after 4 days of culture with radioactive calcium (45CaCl2) and was performed for different time intervals. The Ca2+ transport is expressed as nmole of Ca2+ (from specific activity) per milligram of cellular proteins. The results are the mean ± SEM of experiment performed in duplicates on cell preparations from five normal and four PE placentas. (B) The viability of trophoblasts from day 1 to day 4 of culture is not significantly decreasing in PE cultured cells compared to normal. The viability was measured by the MTT assay and the results are shown as optic density measured at 570 nm of the blue formazan crystals formed.
Fig 2
Fig 2
Protein and mRNA expression of calcium channels TRPV5 and TRPV6 in placentas coming from normal women compared to women with PE. (A) The protein expression of TRPV5 is significantly decreased in placentas PE compared to normal ones (P= 0.0008). (B) TRPV5 mRNA expression is decreased in PE compared to normal placentas (P= 0.0044). (C) The protein expression of TRPV6 is significantly decreased in placentas with PE compared to normal ones (P= 0.0029). (D) The mRNA expression of TRPV6 is significantly decreased in PE compared to normal placentas (P= 0.0156). The number of placentas tested for the mRNA expression is shown in parentheses for (B) and (D). For protein and mRNA expression, data were normalized according to amido black total protein levels and to HPRT1 housekeeping gene, respectively. *P < 0.05.
Fig 3
Fig 3
Protein and mRNA expression of CaBP-9K and CaBP-28K in placentas coming from healthy women compared to women with PE. (A) The placental protein expression of CaBP-9K is significantly decreased in PE placentas compared to normal ones (P= 0.0268). (B) CaBP-9K mRNA expression is significantly lower in PE compared to normal placentas (P= 0.0465). (C) The protein expression of the CaBP-28K gene is decreased in placentas with PE (P= 0.0055). (D) The mRNA expression of CaBP-28K is significantly decreased in placentas with PE compared to normal placentas (P= 0.0383). The number of placentas tested for the mRNA expression is shown in parentheses for (B) and (D). For protein and mRNA expression, data were normalized according to amido black total protein levels and to HPRT1 housekeeping gene, respectively. *P < 0.05.
Fig 4
Fig 4
Protein and mRNA expression of calcium pumps (PMCA) isoforms 1 and 4 in normal and PE placentas. (A) This graph shows that the protein expression of both PMCA1 and 4 is significantly decreased in placentas PE compared to normal placentas (P= 0.0256). (B) The mRNA expression of PMCA1 is significantly decreased in PE placentas compared to normal group (0.0007). (C) The mRNA expression of PMCA 4 is significantly decreased in PE compared to normal placentas (P= 0.0082). The number of placentas tested for the mRNA expression is shown in parentheses for (B) and (C). For protein and mRNA expression, data were normalized according to amido black total protein levels and to HPRT1 housekeeping gene, respectively. *P < 0.05.
Fig 5
Fig 5
mRNA expression of the ATP synthase gene in normal and PE placentas. The mRNA expression is significantly decreased in PE compared to normal placentas (P= 0.0098). The number of placentas tested for the mRNA expression is shown in parentheses. For mRNA expression, data were normalized according to HPRT1 housekeeping gene. *P <0.05.
Fig 6
Fig 6
mRNA expression of 3 isoforms of the IP3R gene in normal and PE placentas. The mRNA expression is significantly decreased in PE compared to normal placentas for (A) IP3R1 (P= 0.0287) and (B) IP3R2 (P= 0.0366). (C) The mRNA expression of IP3R3 is not altered in PE placentas. The number of placentas tested is shown in parentheses. For mRNA expression, data were normalized according to HPRT1 housekeeping gene. *P < 0.05.
Fig 7
Fig 7
mRNA expression of 3 isoforms of the RyR gene in normal and PE placentas. The mRNA expression is significantly decreased in PE compared to normal placentas for (A) RyR1 (P= 0.0336), (B) RyR2 (P= 0.0320) and (C) RyR3 (P= 0.0179). The number of placentas tested is shown in parentheses. For mRNA expression, data were normalized according to HPRT1 housekeeping gene. *P < 0.05.
Fig 8
Fig 8
mRNA expression of 3 isoforms of the SERCA gene in normal and PE placentas. The mRNA expression is significantly increased in PE compared to normal placentas for (A) SERCA1 (P= 0.0147), (B) SERCA2 (P= 0.0225) and (C) SERCA3 (P= 0.0092). The number of placentas tested is shown in parentheses. For mRNA expression, data were normalized according to HPRT1 housekeeping gene. *P < 0.05.
Fig 9
Fig 9
mRNA expression of 3 isoforms of the VDAC gene in normal and PE placentas. The mRNA expression of (A) VDAC1 and (B) VDAC2 is not altered in PE placentas, while it is significantly increased for (C) the VDAC3 isoforms compared to normal ones (P= 0.0253). The number of placentas tested is shown in parentheses. For mRNA expression, data were normalized according to HPRT1 housekeeping gene. *P < 0.05.
Fig 10
Fig 10
mRNA expression of the hOGG1 gene in normal and PE placentas. The mRNA expression is significantly increased in PE compared to normal placentas (P= 0.0126). The number of placentas tested for the mRNA expression is shown in parentheses. For mRNA expression, data were normalized according to HPRT1 housekeeping gene. *P < 0.05.

Similar articles

Cited by

References

    1. Sibai B, Dekker G, Kupferminc M. Pre-eclampsia. Lancet. 2005;365:785–99. - PubMed
    1. Walker JJ. Pre-eclampsia. Lancet. 2000;356:1260–5. - PubMed
    1. Huppertz B. Placental origins of preeclampsia: challenging the current hypothesis. Hypertension. 2008;51:970–5. - PubMed
    1. Redman CW, Sargent IL. Placental stress and pre-eclampsia: a revised view. Placenta. 2009;30:S38–42. - PubMed
    1. Robinson NJ, Wareing M, Hudson NK, et al. Oxygen and the liberation of placental factors responsible for vascular compromise. Lab Invest. 2008;88:293–305. - PubMed

Publication types

MeSH terms