High-density linkage mapping and evolution of paralogs and orthologs in Salix and Populus
- PMID: 20178595
- PMCID: PMC2834636
- DOI: 10.1186/1471-2164-11-129
High-density linkage mapping and evolution of paralogs and orthologs in Salix and Populus
Abstract
Background: Salix (willow) and Populus (poplar) are members of the Salicaceae family and they share many ecological as well as genetic and genomic characteristics. The interest of using willow for biomass production is growing, which has resulted in increased pressure on breeding of high yielding and resistant clones adapted to different environments. The main purpose of this work was to develop dense genetic linkage maps for mapping of traits related to yield and resistance in willow. We used the Populus trichocarpa genome to extract evenly spaced markers and mapped the orthologous loci in the willow genome. The marker positions in the two genomes were used to study genome evolution since the divergence of the two lineages some 45 mya.
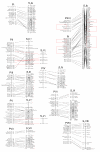
Results: We constructed two linkage maps covering the 19 linkage groups in willow. The most detailed consensus map, S1, contains 495 markers with a total genetic distance of 2477 cM and an average distance of 5.0 cM between the markers. The S3 consensus map contains 221 markers and has a total genetic distance of 1793 cM and an average distance of 8.1 cM between the markers. We found high degree of synteny and gene order conservation between willow and poplar. There is however evidence for two major interchromosomal rearrangements involving poplar LG I and XVI and willow LG Ib, suggesting a fission or a fusion in one of the lineages, as well as five intrachromosomal inversions. The number of silent substitutions were three times lower (median: 0.12) between orthologs than between paralogs (median: 0.37 - 0.41).
Conclusions: The relatively slow rates of genomic change between willow and poplar mean that the genomic resources in poplar will be most useful in genomic research in willow, such as identifying genes underlying QTLs of important traits. Our data suggest that the whole-genome duplication occurred long before the divergence of the two genera, events which have until now been regarded as contemporary. Estimated silent substitution rates were 1.28 x 10⁻⁹ and 1.68 x 10⁻⁹ per site and year, which are close to rates found in other perennials but much lower than rates in annuals.
Figures


Similar articles
-
De novo SNP discovery and genetic linkage mapping in poplar using restriction site associated DNA and whole-genome sequencing technologies.BMC Genomics. 2016 Aug 18;17:656. doi: 10.1186/s12864-016-3003-9. BMC Genomics. 2016. PMID: 27538483 Free PMC article.
-
Major Chromosomal Rearrangements Distinguish Willow and Poplar After the Ancestral "Salicoid" Genome Duplication.Genome Biol Evol. 2016 Jun 27;8(6):1868-75. doi: 10.1093/gbe/evw127. Genome Biol Evol. 2016. PMID: 27352946 Free PMC article.
-
Conversion between duplicated genes generated by polyploidization contributes to the divergence of poplar and willow.BMC Plant Biol. 2022 Jun 17;22(1):298. doi: 10.1186/s12870-022-03684-9. BMC Plant Biol. 2022. PMID: 35710333 Free PMC article.
-
Confirmation of Single-Locus Sex Determination and Female Heterogamety in Willow Based on Linkage Analysis.PLoS One. 2016 Feb 1;11(2):e0147671. doi: 10.1371/journal.pone.0147671. eCollection 2016. PLoS One. 2016. PMID: 26828940 Free PMC article.
-
Genetic strategies for dissecting complex traits in biomass willows (Salix spp.).Tree Physiol. 2014 Nov;34(11):1167-80. doi: 10.1093/treephys/tpt089. Epub 2013 Nov 10. Tree Physiol. 2014. PMID: 24218244 Review.
Cited by
-
De novo SNP discovery and genetic linkage mapping in poplar using restriction site associated DNA and whole-genome sequencing technologies.BMC Genomics. 2016 Aug 18;17:656. doi: 10.1186/s12864-016-3003-9. BMC Genomics. 2016. PMID: 27538483 Free PMC article.
-
Sequencing of the needle transcriptome from Norway spruce (Picea abies Karst L.) reveals lower substitution rates, but similar selective constraints in gymnosperms and angiosperms.BMC Genomics. 2012 Nov 2;13:589. doi: 10.1186/1471-2164-13-589. BMC Genomics. 2012. PMID: 23122049 Free PMC article.
-
High levels of variation in Salix lignocellulose genes revealed using poplar genomic resources.Biotechnol Biofuels. 2013 Aug 7;6(1):114. doi: 10.1186/1754-6834-6-114. Biotechnol Biofuels. 2013. PMID: 23924375 Free PMC article.
-
Identification of a Differentially Expressed TIR-NBS-LRR Gene in a Major QTL Associated to Leaf Rust Resistance in Salix.PLoS One. 2016 Dec 21;11(12):e0168776. doi: 10.1371/journal.pone.0168776. eCollection 2016. PLoS One. 2016. PMID: 28002449 Free PMC article.
-
AFLP-based genetic mapping of the "bud-flowering" trait in heather (Calluna vulgaris).BMC Genet. 2013 Aug 2;14:64. doi: 10.1186/1471-2156-14-64. BMC Genet. 2013. PMID: 23915059 Free PMC article.
References
-
- Li WH. Molecular evolution. Sunderland, Mass: Sinauer Associates Inc; 1997.
Publication types
MeSH terms
Substances
LinkOut - more resources
Full Text Sources

