

Daytime food restriction alters liver glycogen, triacylglycerols, and cell size. A histochemical, morphometric, and ultrastructural study
- PMID: 20178596
- PMCID: PMC2838809
- DOI: 10.1186/1476-5926-9-5
Daytime food restriction alters liver glycogen, triacylglycerols, and cell size. A histochemical, morphometric, and ultrastructural study
Abstract
Background: Temporal restriction of food availability entrains circadian behavioral and physiological rhythms in mammals by resetting peripheral oscillators. This entrainment underlies the activity of a timing system, different from the suprachiasmatic nuclei (SCN), known as the food entrainable oscillator (FEO). So far, the precise anatomical location of the FEO is unknown. The expression of this oscillator is associated with an enhanced arousal prior to the food presentation that is called food anticipatory activity (FAA). We have focused on the study of the role played by the liver as a probable component of the FEO. The aim of this work was to identify metabolic and structural adaptations in the liver during the expression of the FEO, as revealed by histochemical assessment of hepatic glycogen and triacylglycerol contents, morphometry, and ultrastructure in rats under restricted feeding schedules (RFS).
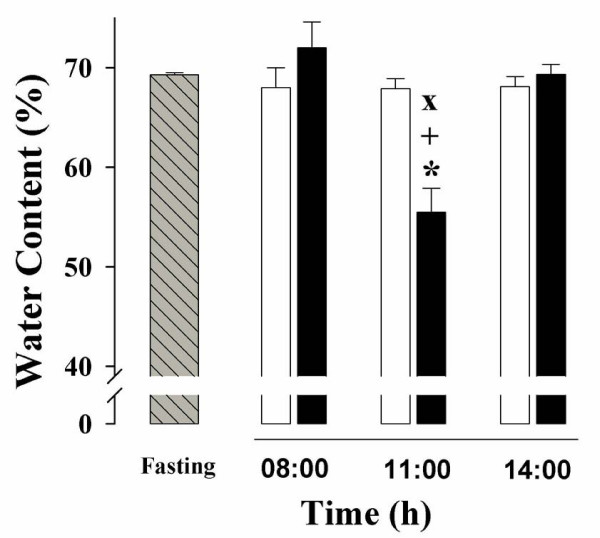
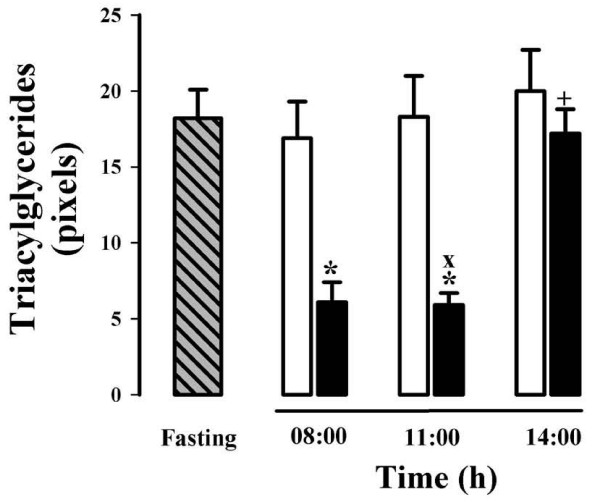
Results: RFS promoted a decrease in the liver/body weight ratio prior to food access, a reduction of hepatic water content, an increase in cross-sectional area of the hepatocytes, a moderate reduction in glycogen content, and a striking decrease in triacylglyceride levels. Although these adaptation effects were also observed when the animal displayed FAA, they were reversed upon feeding. Mitochondria observed by electron microscopy showed a notorious opacity in the hepatocytes from rats during FAA (11:00 h). Twenty four hour fasting rats did not show any of the modifications observed in the animals expressing the FEO.
Conclusions: Our results demonstrate that FEO expression is associated with modified liver handling of glycogen and triacylglycerides accompanied by morphometric and ultrastructural adaptations in the hepatocytes. Because the cellular changes detected in the liver cannot be attributed to a simple alternation between feeding and fasting conditions, they also strengthen the notion that RFS promotes a rheostatic adjustment in liver physiology during FEO expression.
Figures


Similar articles
-
Food restricted schedules promote differential lipoperoxidative activity in rat hepatic subcellular fractions.Comp Biochem Physiol A Mol Integr Physiol. 2007 Apr;146(4):632-43. doi: 10.1016/j.cbpa.2006.02.039. Epub 2006 May 24. Comp Biochem Physiol A Mol Integr Physiol. 2007. PMID: 16725359
-
Restricted feeding entrains rhythms of inflammation-related factors without promoting an acute-phase response.Chronobiol Int. 2009 Oct;26(7):1409-29. doi: 10.3109/07420520903417003. Chronobiol Int. 2009. PMID: 19916839
-
The Mysterious Food-Entrainable Oscillator: Insights from Mutant and Engineered Mouse Models.J Biol Rhythms. 2018 Oct;33(5):458-474. doi: 10.1177/0748730418789043. Epub 2018 Jul 23. J Biol Rhythms. 2018. PMID: 30033846 Free PMC article. Review.
-
Restricted feeding modulates the daily variations of liver glutamate dehydrogenase activity, expression, and histological location.Exp Biol Med (Maywood). 2017 May;242(9):945-952. doi: 10.1177/1535370217699533. Epub 2017 Mar 16. Exp Biol Med (Maywood). 2017. PMID: 28440738 Free PMC article.
-
Competing clocks: metabolic status moderates signals from the master circadian pacemaker.Neurosci Biobehav Rev. 2012 Jan;36(1):254-70. doi: 10.1016/j.neubiorev.2011.06.003. Epub 2011 Jun 12. Neurosci Biobehav Rev. 2012. PMID: 21693133 Review.
Cited by
-
Changes in the 24 h Rhythmicity of Liver PPARs and Peroxisomal Markers When Feeding Is Restricted to Two Daytime Hours.PPAR Res. 2011;2011:261584. doi: 10.1155/2011/261584. Epub 2011 Apr 5. PPAR Res. 2011. PMID: 21822420 Free PMC article.
-
The liver-clock coordinates rhythmicity of peripheral tissues in response to feeding.Nat Metab. 2021 Jun;3(6):829-842. doi: 10.1038/s42255-021-00395-7. Epub 2021 May 31. Nat Metab. 2021. PMID: 34059820 Free PMC article.
-
Alterations of ultrastructural and fission/fusion markers in hepatocyte mitochondria from mice following calorie restriction with different dietary fats.J Gerontol A Biol Sci Med Sci. 2013 Sep;68(9):1023-34. doi: 10.1093/gerona/glt006. Epub 2013 Feb 12. J Gerontol A Biol Sci Med Sci. 2013. PMID: 23403066 Free PMC article.
-
Intermittent Starvation Extends the Functional Lifetime of Primary Human Hepatocyte Cultures.Toxicol Sci. 2020 Apr 1;174(2):266-277. doi: 10.1093/toxsci/kfaa003. Toxicol Sci. 2020. PMID: 31977024 Free PMC article.
-
Transcriptomic Analysis of the Liver Redox Response During Food-Anticipatory Activity Under a Time-Restricted Feeding Protocol in Rats.Antioxidants (Basel). 2025 May 28;14(6):649. doi: 10.3390/antiox14060649. Antioxidants (Basel). 2025. PMID: 40563286 Free PMC article.
References
-
- Nelson W, Halberg F. Meal-timing, circadian rhythms and life span of mice. J Nutr. 1986;116:2244–2253. - PubMed
LinkOut - more resources
Full Text Sources
Miscellaneous