

Carbon-dependent control of electron transfer and central carbon pathway genes for methane biosynthesis in the Archaean, Methanosarcina acetivorans strain C2A
- PMID: 20178638
- PMCID: PMC2838876
- DOI: 10.1186/1471-2180-10-62
Carbon-dependent control of electron transfer and central carbon pathway genes for methane biosynthesis in the Archaean, Methanosarcina acetivorans strain C2A
Abstract
Background: The archaeon, Methanosarcina acetivorans strain C2A forms methane, a potent greenhouse gas, from a variety of one-carbon substrates and acetate. Whereas the biochemical pathways leading to methane formation are well understood, little is known about the expression of the many of the genes that encode proteins needed for carbon flow, electron transfer and/or energy conservation. Quantitative transcript analysis was performed on twenty gene clusters encompassing over one hundred genes in M. acetivorans that encode enzymes/proteins with known or potential roles in substrate conversion to methane.
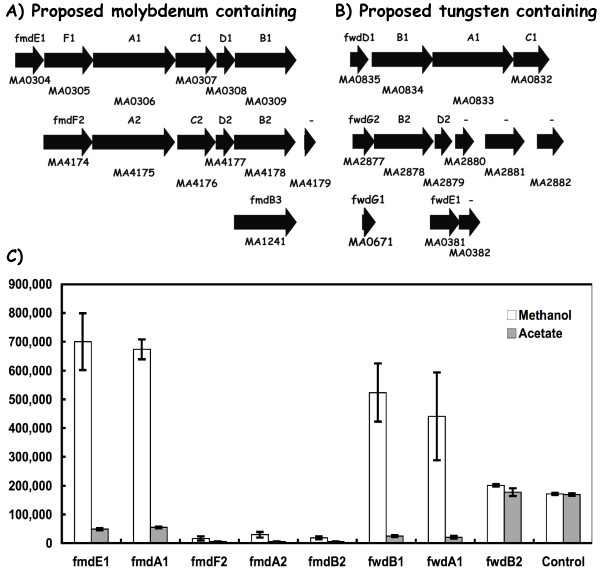
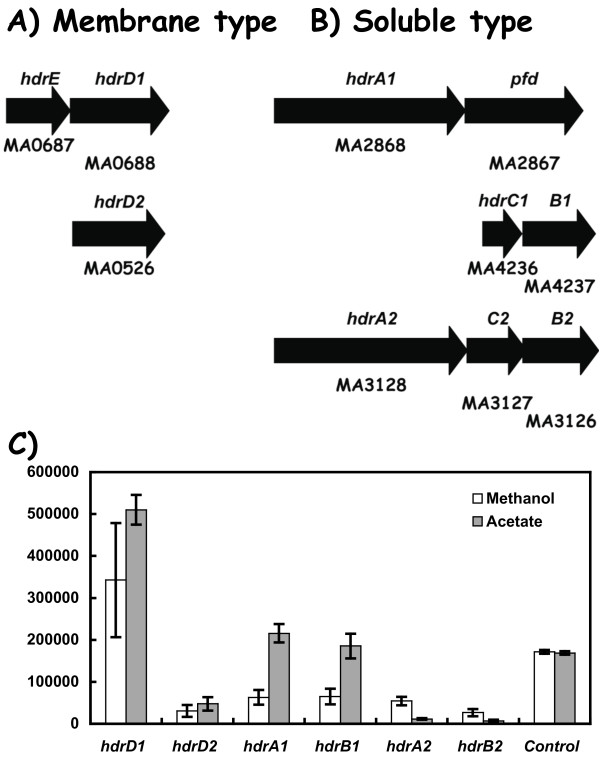
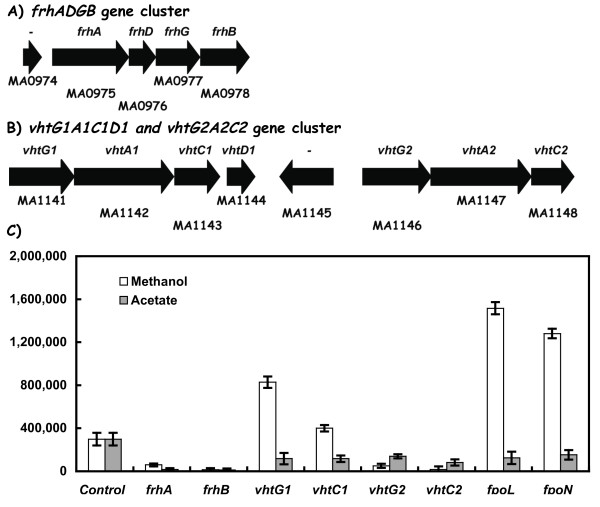
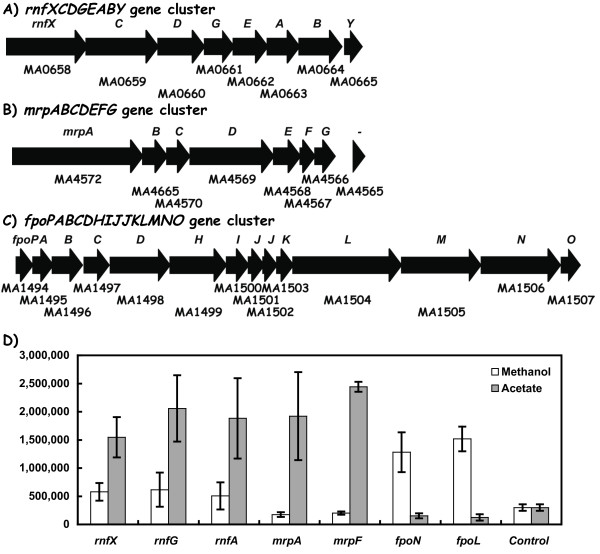
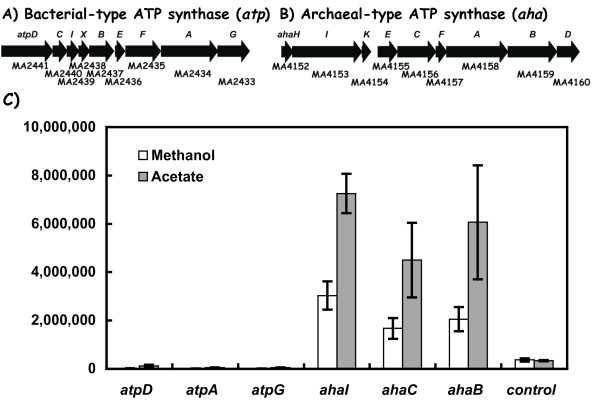
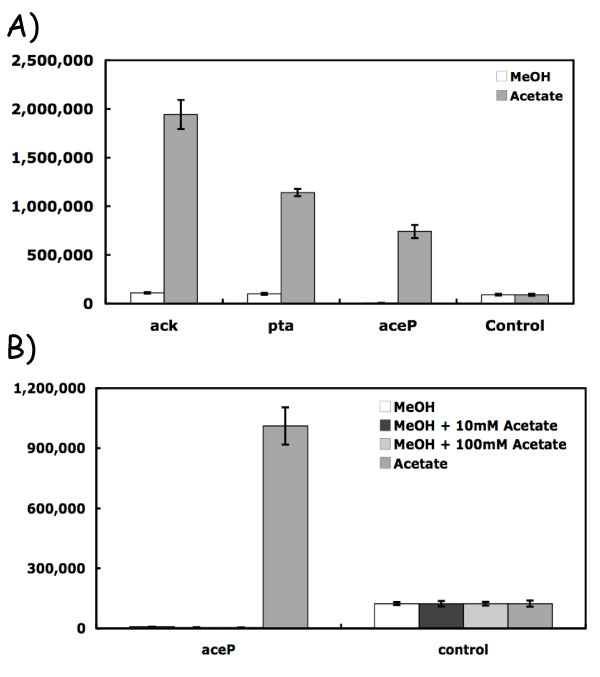
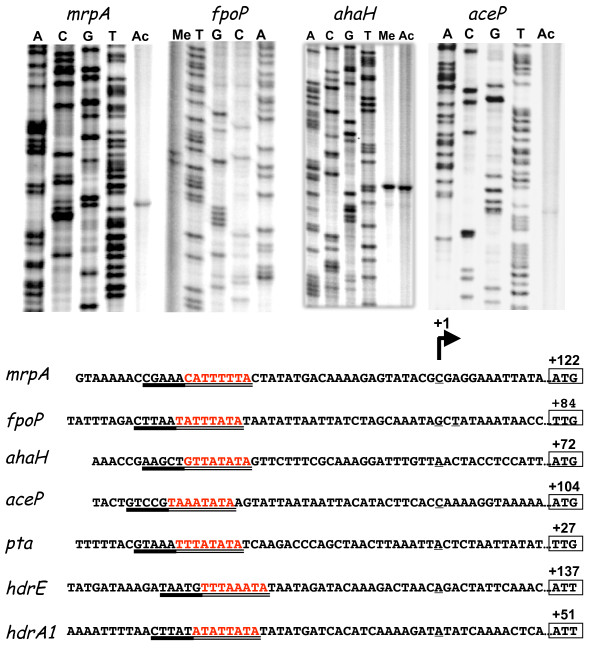
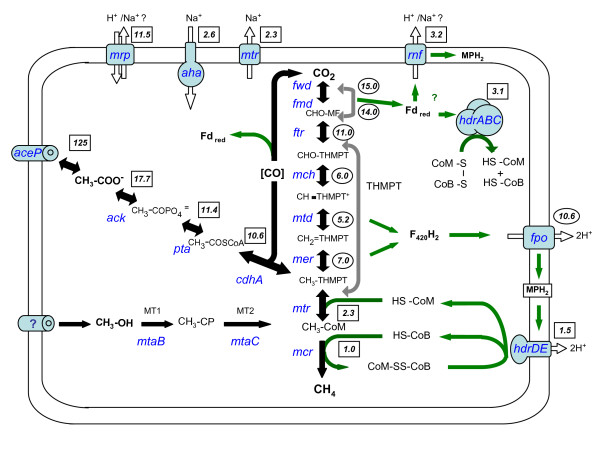
Results: The expression of many seemingly "redundant" genes/gene clusters establish substrate dependent control of approximately seventy genes for methane production by the pathways for methanol and acetate utilization. These include genes for soluble-type and membrane-type heterodisulfide reductases (hdr), hydrogenases including genes for a vht-type F420 non-reducing hydrogenase, molybdenum-type (fmd) as well as tungsten-type (fwd) formylmethanofuran dehydrogenases, genes for rnf and mrp-type electron transfer complexes, for acetate uptake, plus multiple genes for aha- and atp-type ATP synthesis complexes. Analysis of promoters for seven gene clusters reveal UTR leaders of 51-137 nucleotides in length, raising the possibility of both transcriptional and translational levels of control.
Conclusions: The above findings establish the differential and coordinated expression of two major gene families in M. acetivorans in response to carbon/energy supply. Furthermore, the quantitative mRNA measurements demonstrate the dynamic range for modulating transcript abundance. Since many of these gene clusters in M. acetivorans are also present in other Methanosarcina species including M. mazei, and in M. barkeri, these findings provide a basis for predicting related control in these environmentally significant methanogens.
Figures
Similar articles
-
Electron transport in the pathway of acetate conversion to methane in the marine archaeon Methanosarcina acetivorans.J Bacteriol. 2006 Jan;188(2):702-10. doi: 10.1128/JB.188.2.702-710.2006. J Bacteriol. 2006. PMID: 16385060 Free PMC article.
-
A Membrane-Bound Cytochrome Enables Methanosarcina acetivorans To Conserve Energy from Extracellular Electron Transfer.mBio. 2019 Aug 20;10(4):e00789-19. doi: 10.1128/mBio.00789-19. mBio. 2019. PMID: 31431545 Free PMC article.
-
Rerouting Cellular Electron Flux To Increase the Rate of Biological Methane Production.Appl Environ Microbiol. 2015 Oct;81(19):6528-37. doi: 10.1128/AEM.01162-15. Epub 2015 Jul 10. Appl Environ Microbiol. 2015. PMID: 26162885 Free PMC article.
-
Bioenergetics and anaerobic respiratory chains of aceticlastic methanogens.Biochim Biophys Acta. 2014 Jul;1837(7):1130-47. doi: 10.1016/j.bbabio.2013.12.002. Epub 2013 Dec 12. Biochim Biophys Acta. 2014. PMID: 24333786 Review.
-
Redox-driven proton translocation in methanogenic Archaea.Cell Mol Life Sci. 2002 Sep;59(9):1513-33. doi: 10.1007/s00018-002-8526-3. Cell Mol Life Sci. 2002. PMID: 12440773 Free PMC article. Review.
Cited by
-
Magnetite drives microbial community restructuring and stimulates aceticlastic methanogenesis of type II Methanosarcina in mangrove sediments.Microbiome. 2025 Jul 26;13(1):174. doi: 10.1186/s40168-025-02157-z. Microbiome. 2025. PMID: 40713905 Free PMC article.
-
The elements of life: A biocentric tour of the periodic table.Adv Microb Physiol. 2023;82:1-127. doi: 10.1016/bs.ampbs.2022.11.001. Epub 2023 Jan 30. Adv Microb Physiol. 2023. PMID: 36948652 Free PMC article.
-
Comparative genomics reveals electron transfer and syntrophic mechanisms differentiating methanotrophic and methanogenic archaea.PLoS Biol. 2022 Jan 5;20(1):e3001508. doi: 10.1371/journal.pbio.3001508. eCollection 2022 Jan. PLoS Biol. 2022. PMID: 34986141 Free PMC article. Review.
-
Carboxylic Acid Transporters in Candida Pathogenesis.mBio. 2020 May 12;11(3):e00156-20. doi: 10.1128/mBio.00156-20. mBio. 2020. PMID: 32398310 Free PMC article. Review.
-
The genome sequence of Methanohalophilus mahii SLP(T) reveals differences in the energy metabolism among members of the Methanosarcinaceae inhabiting freshwater and saline environments.Archaea. 2010 Dec 23;2010:690737. doi: 10.1155/2010/690737. Archaea. 2010. PMID: 21234345 Free PMC article.
References
-
- Ferry JG, (ed) Methanogenesis; Ecology, Physiology, Biochemistry and Genetics. New York: Chapman and Hall; 1993.
-
- Deppenmeier U. The unique biochemistry of methanogenesis. Prog Nucleic Acid Res Mol Biol. 2002;71:223–283. full_text. - PubMed
Publication types
MeSH terms
Substances
LinkOut - more resources
Full Text Sources
Molecular Biology Databases
