

Genomic sequence of a mutant strain of Caenorhabditis elegans with an altered recombination pattern
- PMID: 20178641
- PMCID: PMC2837035
- DOI: 10.1186/1471-2164-11-131
Genomic sequence of a mutant strain of Caenorhabditis elegans with an altered recombination pattern
Abstract
Background: The original sequencing and annotation of the Caenorhabditis elegans genome along with recent advances in sequencing technology provide an exceptional opportunity for the genomic analysis of wild-type and mutant strains. Using the Illumina Genome Analyzer, we sequenced the entire genome of Rec-1, a strain that alters the distribution of meiotic crossovers without changing the overall frequency. Rec-1 was derived from ethylmethane sulfonate (EMS)-treated strains, one of which had a high level of transposable element mobility. Sequencing of this strain provides an opportunity to examine the consequences on the genome of altering the distribution of meiotic recombination events.
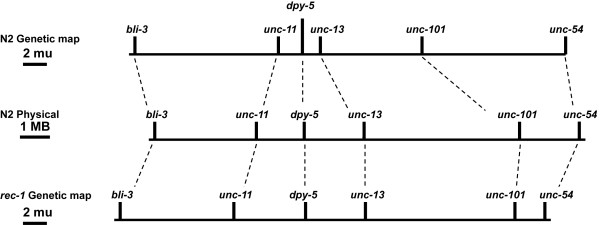
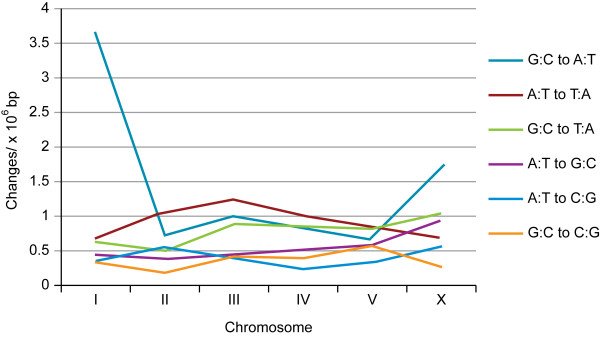
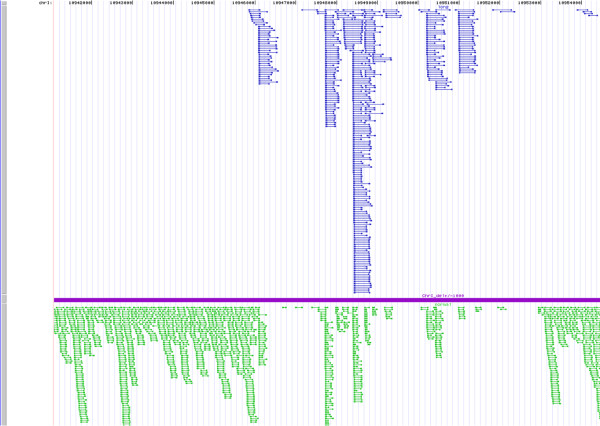
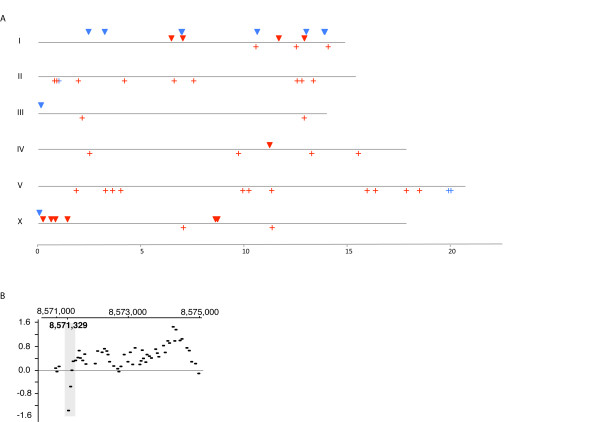
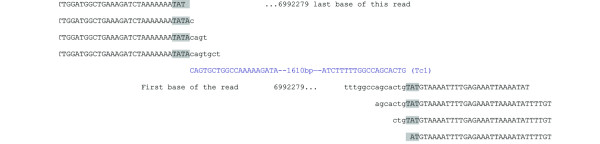
Results: Using Illumina sequencing and MAQ software, 83% of the base pair sequence reads were aligned to the reference genome available at Wormbase, providing a 21-fold coverage of the genome. Using the software programs MAQ and Slider, we observed 1124 base pair differences between Rec-1 and the reference genome in Wormbase (WS190), and 441 between the mutagenized Rec-1 (BC313) and the wild-type N2 strain (VC2010). The most frequent base-substitution was G:C to A:T, 141 for the entire genome most of which were on chromosomes I or X, 55 and 31 respectively. With this data removed, no obvious pattern in the distribution of the base differences along the chromosomes was apparent. No major chromosomal rearrangements were observed, but additional insertions of transposable elements were detected. There are 11 extra copies of Tc1, and 8 of Tc2 in the Rec-1 genome, most likely the remains of past high-hopper activity in a progenitor strain.
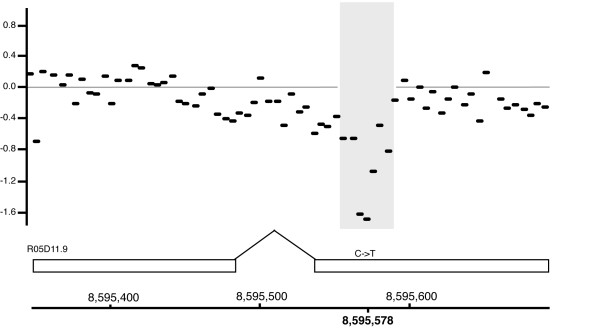
Conclusion: Our analysis of high-throughput sequencing was able to detect regions of direct repeat sequences, deletions, insertions of transposable elements, and base pair differences. A subset of sequence alterations affecting coding regions were confirmed by an independent approach using oligo array comparative genome hybridization. The major phenotype of the Rec-1 strain is an alteration in the preferred position of the meiotic recombination event with no other significant phenotypic consequences. In this study, we observed no evidence of a mutator effect at the nucleotide level attributable to the Rec-1 mutation.
Figures
Similar articles
-
Genome-wide variations in a natural isolate of the nematode Caenorhabditis elegans.BMC Genomics. 2014 Apr 2;15:255. doi: 10.1186/1471-2164-15-255. BMC Genomics. 2014. PMID: 24694239 Free PMC article.
-
Bergerac strains of Caenorhabditis elegans revisited: expansion of Tc1 elements imposes a significant genomic and fitness cost.G3 (Bethesda). 2022 Nov 4;12(11):jkac214. doi: 10.1093/g3journal/jkac214. G3 (Bethesda). 2022. PMID: 35977391 Free PMC article.
-
Strain evolution in Caenorhabditis elegans: transposable elements as markers of interstrain evolutionary history.J Mol Evol. 1995 Apr;40(4):372-81. doi: 10.1007/BF00164023. J Mol Evol. 1995. PMID: 7769614
-
Genome sequence of the nematode C. elegans: a platform for investigating biology.Science. 1998 Dec 11;282(5396):2012-8. doi: 10.1126/science.282.5396.2012. Science. 1998. PMID: 9851916 Review.
-
Towards a mutation in every gene in Caenorhabditis elegans.Brief Funct Genomic Proteomic. 2008 May;7(3):195-204. doi: 10.1093/bfgp/eln016. Epub 2008 Apr 16. Brief Funct Genomic Proteomic. 2008. PMID: 18417533 Review.
Cited by
-
Genomic Identification and Functional Characterization of Essential Genes in Caenorhabditis elegans.G3 (Bethesda). 2018 Mar 2;8(3):981-997. doi: 10.1534/g3.117.300338. G3 (Bethesda). 2018. PMID: 29339407 Free PMC article.
-
Allelic ratios and the mutational landscape reveal biologically significant heterozygous SNVs.Genetics. 2012 Apr;190(4):1225-33. doi: 10.1534/genetics.111.137208. Epub 2012 Jan 20. Genetics. 2012. PMID: 22267497 Free PMC article.
-
High-throughput capturing and characterization of mutations in essential genes of Caenorhabditis elegans.BMC Genomics. 2014 May 12;15(1):361. doi: 10.1186/1471-2164-15-361. BMC Genomics. 2014. PMID: 24884423 Free PMC article.
-
Whole-genome profiling of mutagenesis in Caenorhabditis elegans.Genetics. 2010 Jun;185(2):431-41. doi: 10.1534/genetics.110.116616. Epub 2010 May 3. Genetics. 2010. PMID: 20439774 Free PMC article.
-
akirin is required for diakinesis bivalent structure and synaptonemal complex disassembly at meiotic prophase I.Mol Biol Cell. 2013 Apr;24(7):1053-67. doi: 10.1091/mbc.E12-11-0841. Epub 2013 Jan 30. Mol Biol Cell. 2013. PMID: 23363597 Free PMC article.
References
-
- Hillier LW, Marth GT, Quinlan AR, Dooling D, Fewell G, Barnett D, Fox P, Glasscock JI, Hickenbotham M, Huang W, Magrini VJ, Richt RJ, Sander SN, Stewart DA, Stromberg M, Tsung EF, Wylie T, Schedl T, Wilson RK, Mardis ER. Whole-genome sequencing and variant discovery in C. elegans. Nat Methods. 2008;5(2):183–188. doi: 10.1038/nmeth.1179. - DOI - PubMed
-
- Denver DR, Dolan PC, Wilhelm LJ, Sung W, Lucas-Lledo JI, Howe DK, Lewis SC, Okamoto K, Thomas WK, Lynch M, Baer CF. A genome-wide view of Caenorhabditis elegans base-substitution mutation processes. Proc Natl Acad Sci USA. 2009;106(38):16310–116314. doi: 10.1073/pnas.0904895106. - DOI - PMC - PubMed
Publication types
MeSH terms
Substances
LinkOut - more resources
Full Text Sources
Research Materials
Miscellaneous
