

Pediatric primary central nervous system germ cell tumors of different prognosis groups show characteristic miRNome traits and chromosome copy number variations
- PMID: 20178649
- PMCID: PMC2837036
- DOI: 10.1186/1471-2164-11-132
Pediatric primary central nervous system germ cell tumors of different prognosis groups show characteristic miRNome traits and chromosome copy number variations
Abstract
Background: Intracranial pediatric germ cell tumors (GCTs) are rare and heterogeneous neoplasms and vary in histological differentiation, prognosis and clinical behavior. Germinoma and mature teratoma are GCTs that have a good prognosis, while other types of GCTs, termed nongerminomatous malignant germ cell tumors (NGMGCTs), are tumors with an intermediate or poor prognosis. The second group of tumors requires more extensive drug and irradiation treatment regimens. The mechanisms underlying the differences in incidence and prognosis of the various GCT subgroups are unclear.
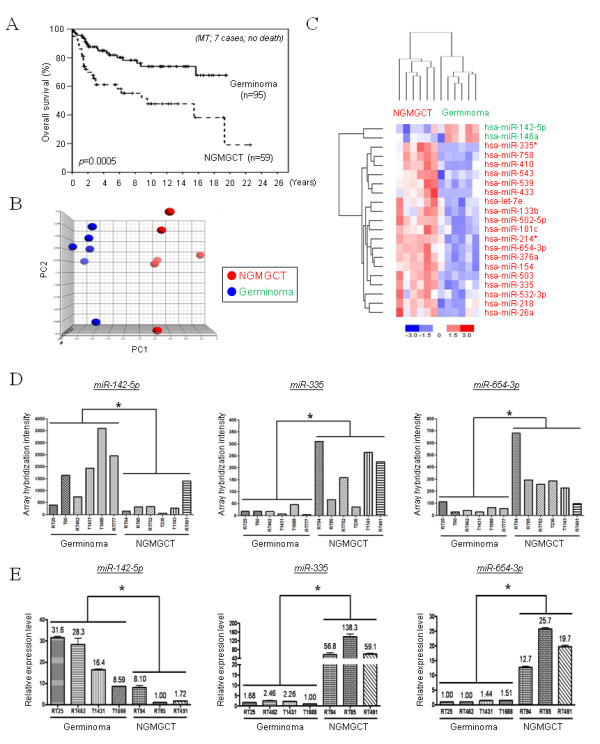
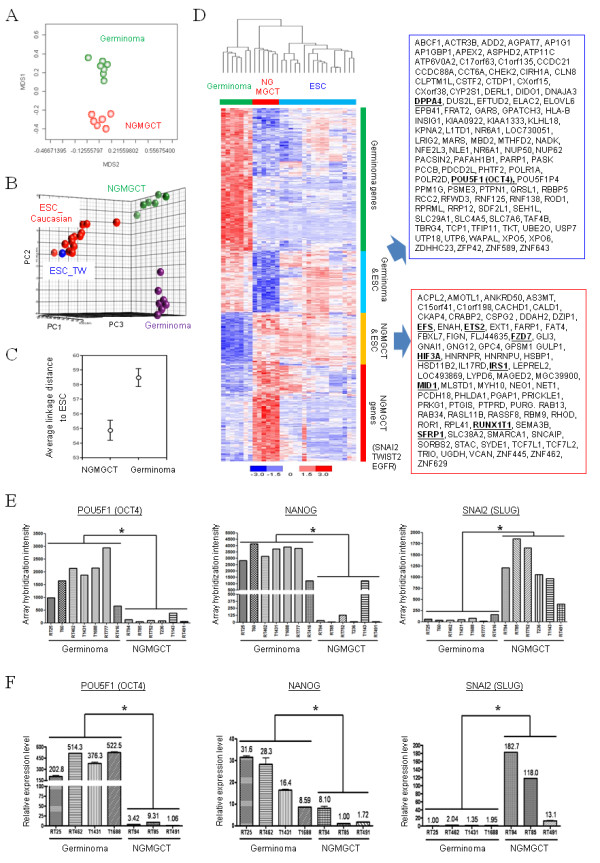
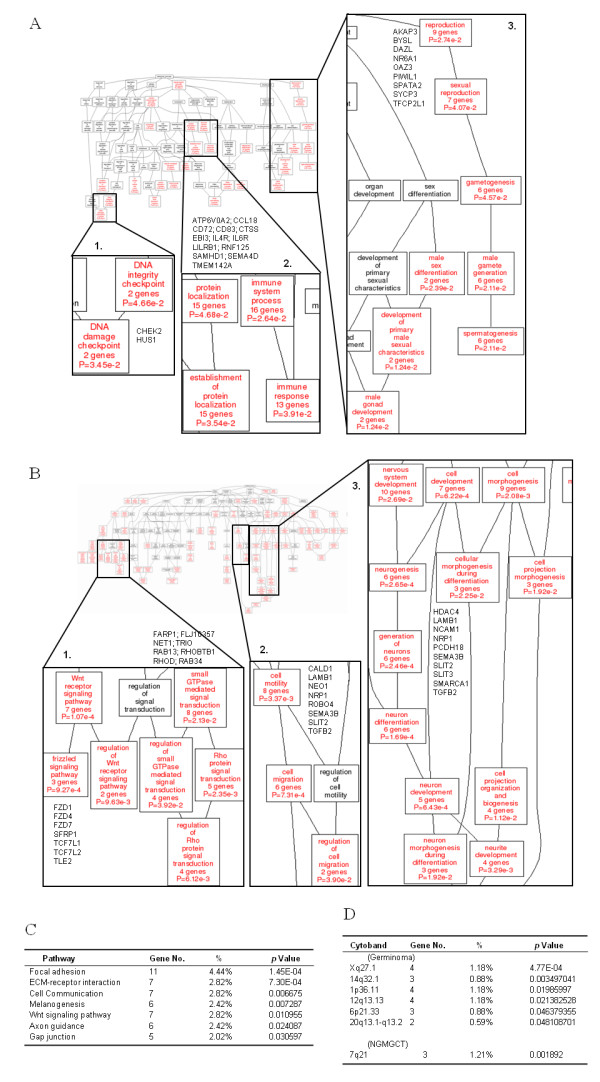
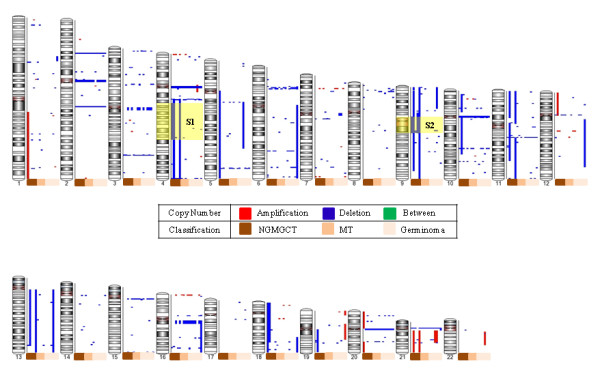
Results: We identified a distinct mRNA profile correlating with GCT histological differentiation and prognosis, and also present in this study the first miRNA profile of pediatric primary intracranial GCTs. Most of the differentially expressed miRNAs were downregulated in germinomas, but miR-142-5p and miR-146a were upregulated. Genes responsible for self-renewal (such as POU5F1 (OCT4), NANOG and KLF4) and the immune response were abundant in germinomas, while genes associated with neuron differentiation, Wnt/beta-catenin pathway, invasiveness and epithelial-mesenchymal transition (including SNAI2 (SLUG) and TWIST2) were abundant in NGMGCTs. Clear transcriptome segregation based on patient survival was observed, with malignant NGMGCTs being closest to embryonic stem cells. Chromosome copy number variations (CNVs) at cytobands 4q13.3-4q28.3 and 9p11.2-9q13 correlated with GCT malignancy and clinical risk. Six genes (BANK1, CXCL9, CXCL11, DDIT4L, ELOVL6 and HERC5) within 4q13.3-4q28.3 were more abundant in germinomas.
Conclusions: Our results integrate molecular profiles with clinical observations and provide insights into the underlying mechanisms causing GCT malignancy. The genes, pathways and microRNAs identified have the potential to be novel therapeutic targets.
Figures
Similar articles
-
Global DNA methylation analysis reveals miR-214-3p contributes to cisplatin resistance in pediatric intracranial nongerminomatous malignant germ cell tumors.Neuro Oncol. 2018 Mar 27;20(4):519-530. doi: 10.1093/neuonc/nox186. Neuro Oncol. 2018. PMID: 29036598 Free PMC article.
-
12p gain is predominantly observed in non-germinomatous germ cell tumors and identifies an unfavorable subgroup of central nervous system germ cell tumors.Neuro Oncol. 2022 May 4;24(5):834-846. doi: 10.1093/neuonc/noab246. Neuro Oncol. 2022. PMID: 34698864 Free PMC article.
-
Malignant germ cell tumors display common microRNA profiles resulting in global changes in expression of messenger RNA targets.Cancer Res. 2010 Apr 1;70(7):2911-23. doi: 10.1158/0008-5472.CAN-09-3301. Epub 2010 Mar 23. Cancer Res. 2010. PMID: 20332240 Free PMC article.
-
Biology of childhood germ cell tumours, focussing on the significance of microRNAs.Andrology. 2015 Jan;3(1):129-39. doi: 10.1111/andr.277. Epub 2014 Oct 9. Andrology. 2015. PMID: 25303610 Free PMC article. Review.
-
Central Nervous System Germ Cell Tumors: A Review of the Literature.J Child Neurol. 2018 Aug;33(9):610-620. doi: 10.1177/0883073818772470. Epub 2018 May 30. J Child Neurol. 2018. PMID: 29848146 Review.
Cited by
-
MicroRNA-profiling of miR-371~373- and miR-302/367-clusters in serum and cerebrospinal fluid identify patients with intracranial germ cell tumors.J Cancer Res Clin Oncol. 2023 Feb;149(2):791-802. doi: 10.1007/s00432-022-03915-4. Epub 2022 Feb 16. J Cancer Res Clin Oncol. 2023. PMID: 35171328 Free PMC article.
-
CNS Germ Cell Tumors: Molecular Advances, Significance in Risk Stratification and Future Directions.Brain Sci. 2024 Apr 29;14(5):445. doi: 10.3390/brainsci14050445. Brain Sci. 2024. PMID: 38790424 Free PMC article. Review.
-
Testing an aflatoxin B1 gene signature in rat archival tissues.Chem Res Toxicol. 2012 May 21;25(5):1132-44. doi: 10.1021/tx3000945. Epub 2012 May 4. Chem Res Toxicol. 2012. PMID: 22545673 Free PMC article.
-
Microrna expression signatures predict patient progression and disease outcome in pediatric embryonal central nervous system neoplasms.J Hematol Oncol. 2014 Dec 31;7:96. doi: 10.1186/s13045-014-0096-y. J Hematol Oncol. 2014. PMID: 25551588 Free PMC article.
-
Multimerin-1 and cancer: a review.Biosci Rep. 2022 Feb 25;42(2):BSR20211248. doi: 10.1042/BSR20211248. Biosci Rep. 2022. PMID: 35132992 Free PMC article. Review.
References
-
- Committee of Brain Tumor Registry of J. Report of Brain Tumor Registry of Japan (1969-1996) Neurol Med Chir (Tokyo) 2003;43(Suppl):i–vii. 1-111. - PubMed
Publication types
MeSH terms
Substances
LinkOut - more resources
Full Text Sources
Molecular Biology Databases
Research Materials
