. 2010 Feb 19;140(4):529-39.
doi: 10.1016/j.cell.2009.12.042.

Elevated ATPase activity of KaiC applies a circadian checkpoint on cell division in Synechococcus elongatus

Affiliations

Elevated ATPase activity of KaiC applies a circadian checkpoint on cell division in Synechococcus elongatus

Guogang Dong et al. Cell. .

Abstract

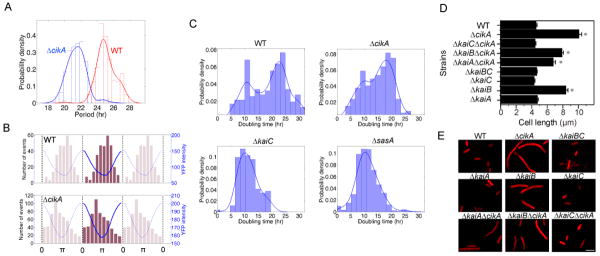
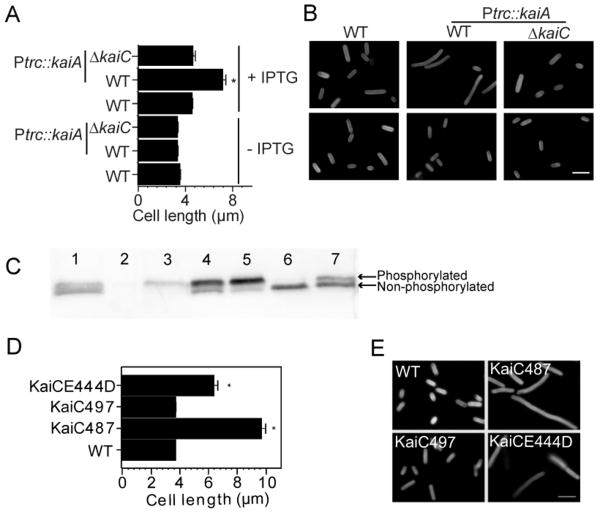
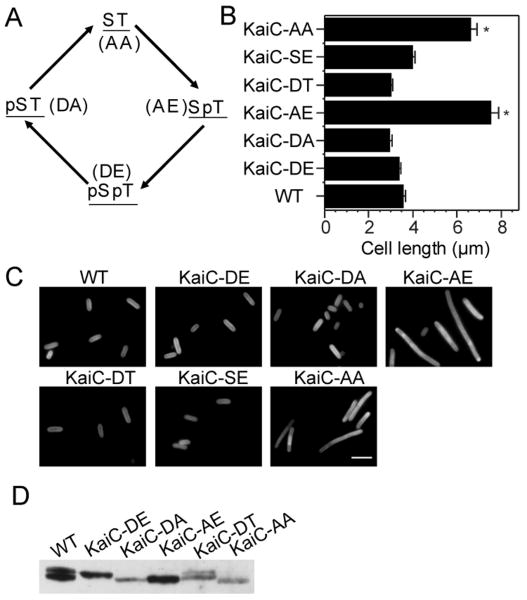
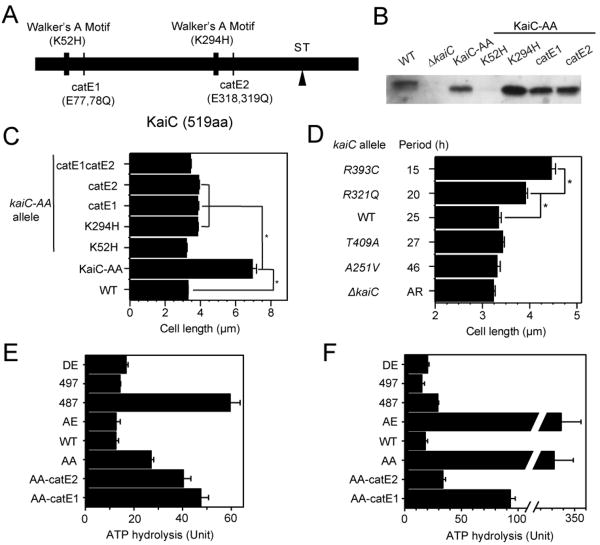
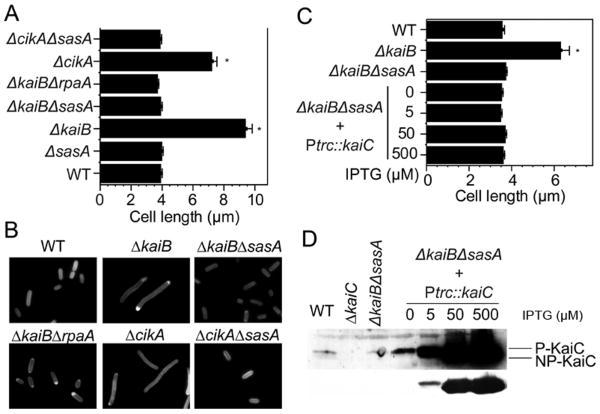
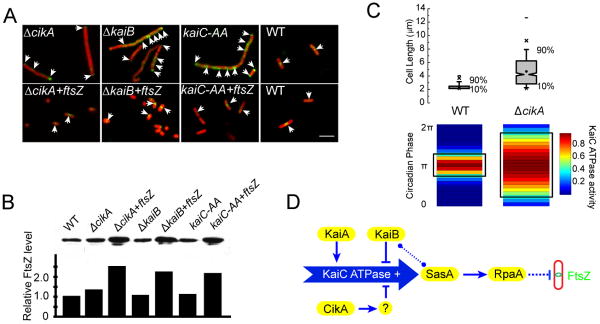
A circadian clock coordinates physiology and behavior in diverse groups of living organisms. Another major cyclic cellular event, the cell cycle, is regulated by the circadian clock in the few cases where linkage of these cycles has been studied. In the cyanobacterium Synechococcus elongatus, the circadian clock gates cell division by an unknown mechanism. Using timelapse microscopy, we confirm the gating of cell division in the wild-type and demonstrate the regulation of cytokinesis by key clock components. Specifically, a state of the oscillator protein KaiC that is associated with elevated ATPase activity closes the gate by acting through a known clock output pathway to inhibit FtsZ ring formation at the division site. An activity that stimulates KaiC phosphorylation independently of the KaiA protein was also uncovered. We propose a model that separates the functions of KaiC ATPase and phosphorylation in cell division gating and other circadian behaviors.


Figures

Figure 1
Figure 1. Gating of Cell Division and Comparison of Cell Lengths in Various Clock Mutants
(A) Distributions of circadian periods for WT (red) and cikA mutant (blue). Periods are defined as peak-to-peak time differences of individual cell traces. Curves are obtained by Gaussian kernel smooth with a kernel width of 0.5 h. (B) Histograms of phases for WT and cikA mutant. Phases are normalized to one period of [0 2π], where 0 starts at each YFP peak position. Averaged YFP signals (blue curves) were plotted on top of the histograms to indicate the gating position relative to kaiBC promoter activity. To highlight the periodicity of circadian cycles, data were copied (light pink) and shown adjacent to the original data (dark pink). (C) Distributions of doubling time for the WT and three clock mutants. Doubling time of individual cells is defined as the time interval between two consecutive cell division events. Probability density is calculated by multiplying the bin width by the ratio of cell division events within one bin/all cell division events. Curves are obtained by Gaussian kernel smooth with a kernel width of 1.85 h. (D) Cell length of various clock mutants. An asterisk indicates that the cell length is significantly different from that of WT. n>150. p<0.001. Error bar = ±1 standard error of the mean (S.E.M.). Also see Figure S1. (E) Representative micrographs of cells from (D). Autofluorescence from photosynthetic pigments distributed along the periphery of cells was captured. Scale bar = 5 μm. All subsequent figures use the same settings unless otherwise noted.
Figure 2
Figure 2. Constitutive Phosphorylation of KaiC Inhibits Cell Division
(A) KaiA overexpression causes cell elongation in the WT background but not in a kaiC null background. See also Figure S2. (B) Representative micrographs of cells from (A). (C) Immunoblots of various strains showing KaiC phosphorylation states. Lane 1: WT; 2: ΔkaiC; 3: ΔkaiB; 4 and 5: Ptrc∷kaiA expressed in the WT background in the absence (4) or presence (5) of 1 mM IPTG; 6: ΔkaiA; 7: ΔkaiAΔcikA. See also Figure S2. (D) KaiC487 and KaiCE444D mutants cause cell elongation whereas KaiC497 does not. (E) Representative micrographs of cells from (D).
Figure 3
Figure 3. Constitutive KaiC Phosphorylation Is Not Required for Cell Elongation
(A) Ordered phosphorylation steps of KaiC and amino acid substitutions that mimic each phosphoform. (B) Effects of KaiC phosphomimetics on cell length. (C) Representative micrographs of cells shown in (B). (D) Immunoblot of KaiC demonstrates the expression of KaiC phosphomimetics. KaiC-SE was undetectable and thus not shown.
Figure 4
Figure 4. High ATPase Activity of KaiC Coincides with Cell Elongation
(A) Illustration of Walker's A motifs identified in KaiC and point mutations used to disrupt them. (B) Point mutations that disrupt ATPase motifs significantly reduce cell length in the KaiC-AA mutant. An asterisk marks statistically significant difference of cell lengths between the connected strains. (C) Immunoblot of KaiC reveals the expression level of KaiC ATPase mutants. (D) Circadian period and cell length. (E) ATPase activity of KaiC WT and mutant variants expressed in units of 1 ATP hydrolyzed × KaiC monomer-1 × day-1. (F) ATPase activity of KaiC WT and mutant variants incubated with KaiA and KaiB, reported as in panel E. See also Figure S3.
Figure 5
Figure 5. SasA and RpaA Are Downstream of CikA and the Central Oscillator in the Control of Cell Division
(A) Knockout of sasA or rpaA from cikA or kaiB null strains releases inhibition of cell division. (B) Representative micrographs of cells from (A). (C) Elevated level of KaiC does not induce the cell elongation phenotype in the ΔkaiBΔsasA strain. (D) Immunoblot analysis shows abundance of KaiC in strains measured in (C). The lower panel is a shorter exposure of the upper panel. KaiC is less abundant in the ΔkaiBΔsasA strain than in WT; expression of Ptrc∷kaiC in this background elevated KaiC level to different degrees, depending on the concentration of IPTG. Even at 0- 5 μM IPTG, KaiC is higher than in the WT and is predominantly in the phosphorylated form.
Figure 6
Figure 6. Localization of FtsZ Is Regulated by the Circadian Clock
(A) Suppression of mislocalized FtsZ in elongated-cell clock mutants by ectopic expression of ftsZ. FtsZ was detected by immunofluorescence microscopy. Red indicates autofluorescence from phycobilisomes, whereas green is the FtsZ signal. White arrows indicate FtsZ localization. (B) Comparison of FtsZ levels in the WT and strains measured in (A). Top: immunoblot using FtsZ antiserum. Bottom: Quantification of the relative levels of FtsZ shown on top. Level of FtsZ in the WT is set at 1. (C) A model of gating of cell division by elevated ATPase activity of KaiC. The bottom panel is the ATPase activity of KaiC for WT and the ΔcikA mutant in one circadian period represented in colormaps, with the maximum activity normalized to 1. When ATPase activity is above a certain threshold as indicated in the black frames overlaying the colormaps, cell division is inhibited; this inhibition window is termed the ‘gate’. In the ΔcikA mutant, ATPase activity still oscillates, but the basal level is elevated due to the stimulation from an unknown factor, which results in a wider window of inhibition of cell division every day, and thus the larger cell size. The box plots in the top panel depict cell length distributions which depend on the different inhibition windows of WT and the ΔcikA mutant. Cell lengths are generated by stochastic simulation based on a gating model described in Figure S4. (D) A signal transduction pathway of the circadian clock in gating cell division. KaiA stimulates KaiC ATPase activity, and KaiB lowers it. CikA represses KaiC ATPase activity through an unknown activity (question mark). Elevated ATPase activity of KaiC (+) activates SasA and subsequently RpaA, turning on the output pathway, which in turn disturbs FtsZ localization at the septation site (likely to be indirect). KaiB may compete with SasA (dotted line with knobs) while lowering KaiC ATPase activity to turn down the output pathway.

Comment in

Similar articles

Cited by

References

    1. Bell-Pedersen D, Cassone VM, Earnest DJ, Golden SS, Hardin PE, Thomas TL, Zoran MJ. Circadian rhythms from multiple oscillators: lessons from diverse organisms. Nat Rev Genet. 2005;6:544–556. - PMC - PubMed
    1. Chabot JR, Pedraza JM, Luitel P, van Oudenaarden A. Stochastic gene expression out-of-steady-state in the cyanobacterial circadian clock. Nature. 2007;450:1249–1252. - PubMed
    1. Chen Z, Odstrcil EA, Tu BP, McKnight SL. Restriction of DNA replication to the reductive phase of the metabolic cycle protects genome integrity. Science. 2007;316:1916–1919. - PubMed
    1. Clerico EM, Ditty JL, Golden SS. Methods in molecular biology. Vol. 362. Clifton, NJ: 2007. Specialized techniques for site-directed mutagenesis in cyanobacteria; pp. 155–171. - PubMed
    1. Dong G, Golden SS. How a cyanobacterium tells time. Curr Opin Microbiol. 2008;11:541–546. - PMC - PubMed

Publication types

MeSH terms

LinkOut - more resources