. 2010 Apr 23;285(17):12840-50.
doi: 10.1074/jbc.M109.081554. Epub 2010 Feb 23.

The anti-tumorigenic properties of peroxisomal proliferator-activated receptor alpha are arachidonic acid epoxygenase-mediated

Affiliations

The anti-tumorigenic properties of peroxisomal proliferator-activated receptor alpha are arachidonic acid epoxygenase-mediated

Ambra Pozzi et al. J Biol Chem. .

Abstract

Prevalence and mortality make cancer a health challenge in need of effective and better tolerated therapeutic approaches, with tumor angiogenesis identified as a promising target for drug development. The epoxygenase products, the epoxyeicosatrienoic acids, are pro-angiogenic, and down-regulation of their biosynthesis by peroxisomal proliferator-activated receptor alpha (PPARalpha) ligands reduces tumor angiogenesis and growth. Endothelial cells lacking a Cyp2c44 epoxygenase, a PPARalpha target, show reduced proliferative and tubulogenic activities that are reversed by the enzyme's metabolites. In a mouse xenograft model of tumorigenesis, disruption of the host Cyp2c44 gene causes marked reductions in tumor volume, mass, and vascularization. The relevance of these studies to human cancer is indicated by the demonstration that: (a) activation of human PPARalpha down-regulates endothelial cell CYP2C9 epoxygenase expression and blunts proliferation and tubulogenesis, (b) in a PPARalpha-humanized mouse model, activation of the receptor inhibits tumor angiogenesis and growth, and (c) the CYP2C9 epoxygenase is expressed in the vasculature of human tumors. The identification of anti-angiogenic/anti-tumorigenic properties of PPARalpha points to a role for the receptor and its epoxygenase regulatory target in the pathophysiology of cancer, and for its ligands as candidates for the development of a new generation of safer and better tolerated anti-cancer drugs.


Figures
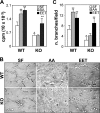
FIGURE 1.
FIGURE 1.
The Cyp2c44 epoxygenase mediates the basal and AA-stimulated proliferative and tubulogenic activities of endothelial cells. Primary cultures of lung endothelial cells from wild-type (WT) and Cyp2c44−/− (KO) mice in serum-free media (SF) or in serum-free media containing arachidonic acid (AA) (5 μm) or 11,12-EET (EET) (1 μm) were: A, cultured 48 h prior to the addition of [3H]thymidine (0.1 μCi/well) and then their proliferation quantified as described under “Experimental Procedures.” Values are averages ± S.D. calculated from three experiments, each performed in quadruplicates. * and ** indicate significant differences (p < 0.05) between untreated or treated WT and KO cells, respectively; B and C, plated onto Matrigel and the formation of tube-like structures analyzed by light microscopy. B, representative images of capillary like structures taken 6 h after plating. C, capillary network formation was quantified as described under “Experimental Procedures,” and the values are averages ± S.D. of branch number per microscope field, calculated from three experiments each performed in triplicates. * and ** are as in A.
FIGURE 2.
FIGURE 2.
The Cyp2c44 epoxygenase is a component of VEGF-stimulated angiogenic pathways. WT and KO endothelial cells were: A, cultured in SF medium with or without the indicated VEGF concentrations and proliferation determined as described under “Experimental Procedures.” Values are averages ± S.D. calculated from three experiments performed in quadruplicates. * and ** are as in Fig. 1A. B and C, plated onto Matrigel in SF medium with or without VEGF (50 ng/ml). B, representative images of capillary-like structures taken 6 h after plating. C, capillary network formation was quantified as described under “Experimental Procedures,” and the values are averages ± S.D. of branch number per microscope field, calculated from three experiments each performed in triplicates. * and ** are as in Fig. 1A. D and E, serum starved for 24 h and then treated with vehicle, VEGF (50 ng/ml), AA (5 μm), or 11,12-EET (1 μm) (lanes 1, 2, 3, and 4, respectively) for 20 min, and an equal amount of cell lysate protein (20 μg/lane) was analyzed by Western blot for levels of activated and total ERK and Akt (D), or activated and total VEGR2 (E). Vertical lines indicate non-adjacent gel lanes. F and G, pAkt, tAkt, pERK, tERK, pVEGFR2, and tVEGFR2 bands were quantified by densitometry analysis, and the signal was expressed as a pAKt/tAkt (F), pERK/tERK (F), and pVEGFR2/tVEGFR2 (G) ratio. Values are the mean of two experiments that differ from the mean by <20%.
FIGURE 3.
FIGURE 3.
The Cyp2c44 epoxygenase regulates tumor growth and angiogenesis. Groups of WT and Cyp2c44−/− (KO) mice were either left untreated of administered Wyeth (0.02%, v/v) in their drinking water for 2 days prior to receiving two subcutaneous injections with p60.5 cells. Wyeth treatment was continued for the next 2 weeks, at which point mice were sacrificed, and their tumor load quantified. A, representative images of tumors grown in untreated WT and KO mice, and in Wyeth-treated KO mice. B and C, quantification of the weight (B) and volume (C) of the tumors grown in untreated and Wyeth-treated WT and KO mice. Circles show individual tumor values, while bars show mean values. D and E, frozen sections of tumors from untreated WT and KO mice, and from Wyeth-treated KO mice were stained with anti-mouse CD31 antibodies (D), and their degrees of vascularization quantified as percent of the area occupied by CD31-positive structures per microscopic field (E). The values in E are averages ± S.D. calculated from ten tumors/group with two images analyzed per tumor.
FIGURE 4.
FIGURE 4.
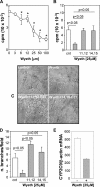
Wyeth inhibits the proliferative and tubulogenic activities of human endothelial cells. Human microvascular endothelial cells were: A, cultured in medium containing 2.5% fetal calf serum without Wyeth, or with Wyeth added at the indicated concentrations, and their proliferation was determined as described under “Experimental Procedures.” Values are averages ± S.D. of three experiments performed in quadruplicates. *, significant differences (p < 0.05) between untreated and Wyeth-treated cells. B, cultured in media containing 2.5% fetal calf serum (cnt) with or without Wyeth (25 μm) or a mixture of Wyeth (25 μm) and 11,12-EET or 14,15-EET (1 μm each), and their proliferation determined as above. C and D, plated onto Matrigel in SF medium (cnt) with or without Wyeth (25 μm) or a mixture of Wyeth (25 μm) and 11,12-EET or 14,15-EET (1 μm each). C, representative images of capillary-like structures taken 6 h after plating. D, capillary network formation was quantified as described under “Experimental Procedures,” and the values are averages ± S.D. of branches per microscope field calculated from three experiments each performed in triplicates. E, the levels of CYP2C9 mRNA in untreated and Wyeth-treated cells were analyzed by quantitative real-time PCR and normalized using the β-actin mRNA as reference. Values are averages ± S.D. calculated from six determinations done with reverse-transcribed products from two different experiments.
FIGURE 5.
FIGURE 5.
Ligand activation of human PPARα in PPARα humanized (hPPARα) mice blunts tumor angiogenesis and growth. Groups of WT and hPPARα mice were either left untreated or administered Wyeth (0.02%, v/v) in their drinking water for 2 days prior to receiving two subcutaneous injections with p60.5 cells. Wyeth treatment was continued for the next 2 weeks, at which point mice were sacrificed, and their tumor load was quantified. A, representative images of tumors grown in untreated and Wyeth-treated WT and hPPARα mice. B and C, quantification of the weight (B) and volume (C) of tumors grown in untreated and Wyeth-treated WT and hPPARα mice. Circles show individual tumor values, whereas bars show mean values. D and E, frozen sections of tumors from untreated (control) and Wyeth-treated (Wyeth) WT and hPPARα mice were stained with anti-mouse CD31 antibodies (D), and their degrees of vascularization was quantified as the percentage of the area occupied by CD31-positive structures per microscopic field (E). The values in panel E are averages ± S.D. calculated from ten tumors/group with two images analyzed per tumor.
FIGURE 6.
FIGURE 6.
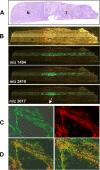
Mass spectral identification of CYP2C9 as a tumor-expressed human epoxygenase. A and B, frozen serial sections of a human clear renal cell carcinoma were stained with either hematoxylin & eosin for evaluation of tumor-free (N) and tumor-containing (T) areas (A) or co-stained with anti-human CYP2C9 (red) and anti-human CD31 (green) to visualize the localization of CYP2C9 (C). D, overlay images show the expression of CYP2C9 epoxygenase in the tumor-associated vasculature. B, trypsin-digested serial sections of the human cell carcinoma shown in A were analyzed by mass spectral imaging at m/z 1491, 2415, and 3017, diagnostic for CYP2C9. Laser sampling was done using the dot matrix shown superimposed to a light microscopy image of the sections. CYP2C9-positive regions are identified by co-localization of mass signals derived from the CYP2C9 diagnostic peptides shown in green.
FIGURE 7.
FIGURE 7.
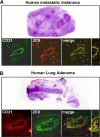
Vascular expression of the CYP2C9 epoxygenase in human tumors. A, frozen serial sections of a human lymph node with metastatic melanoma were stained with hematoxylin & eosin for evaluation of metastasis or exposed to anti-human CYP2C9 (red) or anti-human CD31 (green) antibodies to visualize CYP2C9 expression and vascular structures. Overlay images reveal expression of the CYP2C9 epoxygenase in tumor-associated vasculature. B, frozen serial sections of a human lung adenoma were stained with hematoxylin & eosin, or co-stained with anti-human CYP2C9 (green) and anti-human CD31 (red) to visualize CYP2C9 expression and vascular structures. Overlay images reveal expression of CYP2C9 epoxygenase in tumor-associated vasculature.

Similar articles

Cited by

References

    1. Folkman J. (2006) Annu. Rev. Med. 57, 1–18 - PubMed
    1. Folkman J. (2007) Nat. Rev. Drug Discov. 6, 273–286 - PubMed
    1. Wu C. W., Yu J., Sung J. J. (2009) Oncol. Rep. 22, 451–457 - PubMed
    1. Ondrey F. (2009) Clin. Cancer Res. 15, 2–8 - PubMed
    1. Wang D., Dubois R. N. (2008) PPAR Res. 2008, 931074. - PMC - PubMed

Publication types

MeSH terms