. 2010 Apr 23;285(17):13107-20.
doi: 10.1074/jbc.M110.100420. Epub 2010 Feb 23.

Molecular interplay between mammalian target of rapamycin (mTOR), amyloid-beta, and Tau: effects on cognitive impairments

Affiliations

Molecular interplay between mammalian target of rapamycin (mTOR), amyloid-beta, and Tau: effects on cognitive impairments

Antonella Caccamo et al. J Biol Chem. .

Abstract

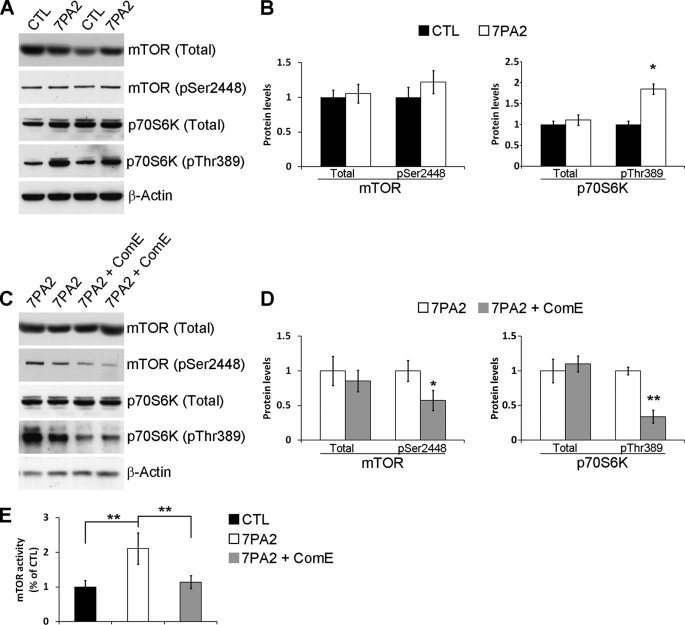
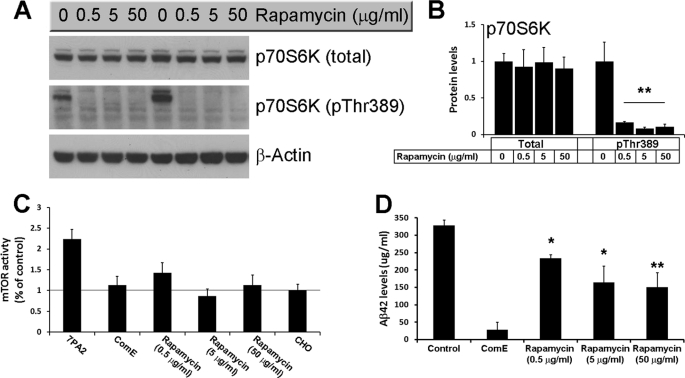
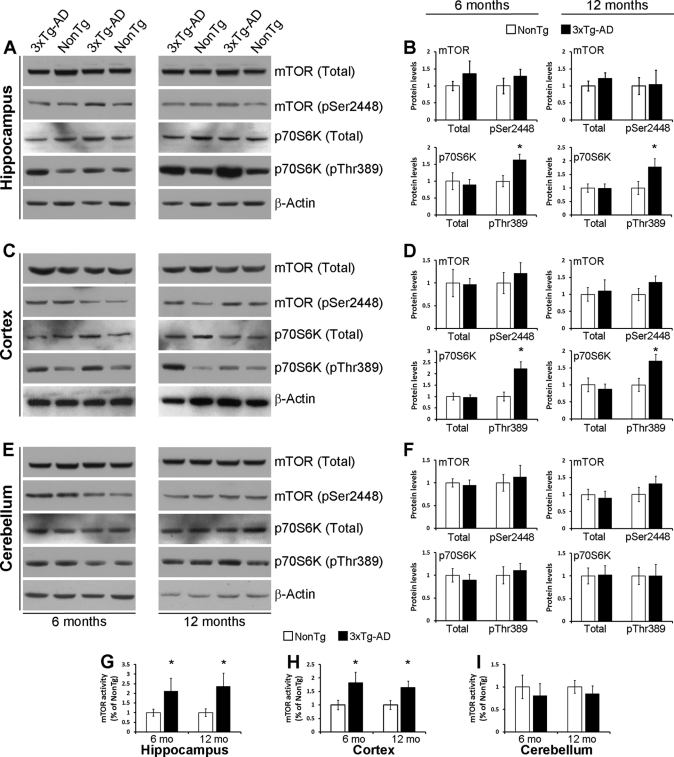
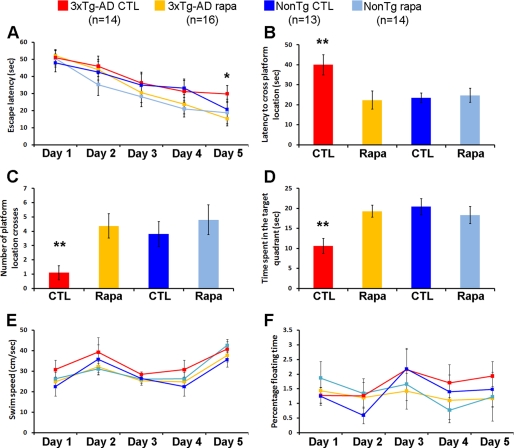
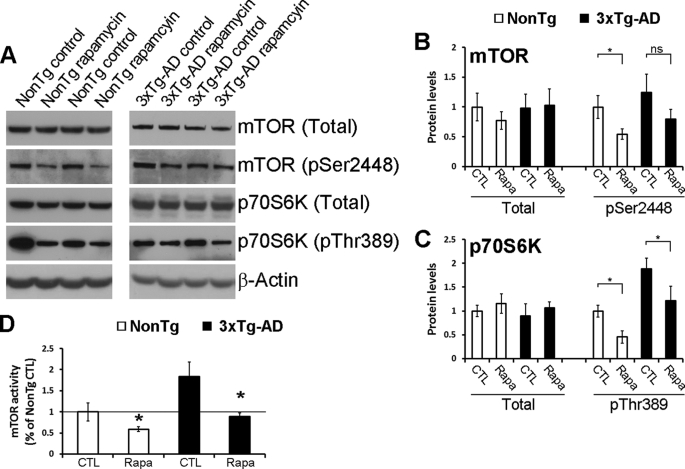
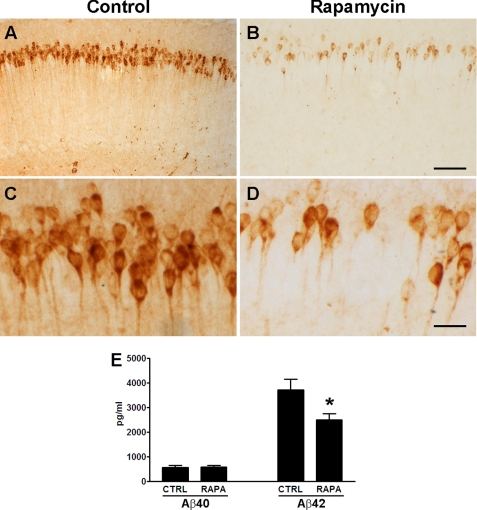
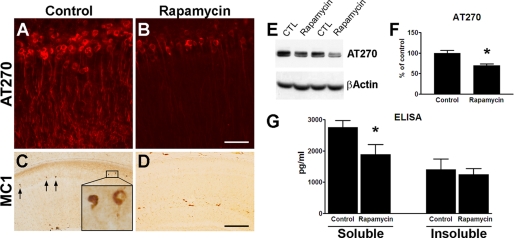
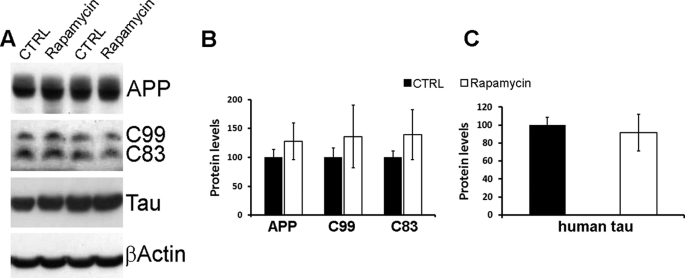
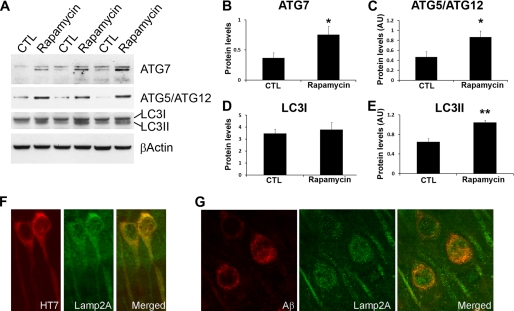
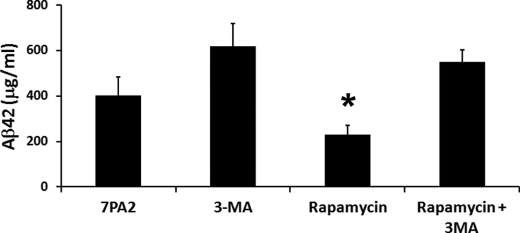
Accumulation of amyloid-beta (Abeta) and Tau is an invariant feature of Alzheimer disease (AD). The upstream role of Abeta accumulation in the disease pathogenesis is widely accepted, and there is strong evidence showing that Abeta accumulation causes cognitive impairments. However, the molecular mechanisms linking Abeta to cognitive decline remain to be elucidated. Here we show that the buildup of Abeta increases the mammalian target of rapamycin (mTOR) signaling, whereas decreasing mTOR signaling reduces Abeta levels, thereby highlighting an interrelation between mTOR signaling and Abeta. The mTOR pathway plays a central role in controlling protein homeostasis and hence, neuronal functions; indeed mTOR signaling regulates different forms of learning and memory. Using an animal model of AD, we show that pharmacologically restoring mTOR signaling with rapamycin rescues cognitive deficits and ameliorates Abeta and Tau pathology by increasing autophagy. Indeed, we further show that autophagy induction is necessary for the rapamycin-mediated reduction in Abeta levels. The results presented here provide a molecular basis for the Abeta-induced cognitive deficits and, moreover, show that rapamycin, an FDA approved drug, improves learning and memory and reduces Abeta and Tau pathology.


Figures

FIGURE 1.
FIGURE 1.
Aβ increases mTOR signaling in 7PA2 cells. A, representative Western blots of proteins extracted from control or 7PA2 cells and probed with total and phospho-specific anti-mTOR and p70S6K antibodies. B, densitometric analysis of the blots (normalized to β-actin) showed that the levels of total and mTOR phosphorylated at Ser2448 were similar between control and 7PA2 cells. Although the levels of total p70S6K were also similar between control and 7PA2 cells, the steady-state levels of p70S6K phosphorylated at Thr389 (p70S6K-Thr389) were significantly higher in 7PA2 cells (n = 9; horizontal line). C, representative Western blots of proteins extracted from 7PA2 cells treated with the γ-secretase inhibitor Compound E (ComE) or vehicle. The horizontal line shows the levels pf mTOR activity in control. D, densitometric analysis (normalized to β-actin) shows that blocking Aβ production does not alter total mTOR and p70S6K levels but significantly decreases the steady-state levels of phosphorylated mTOR and p70S6K at Ser2448 and Thr389, respectively (n = 9). E, mTOR enzymatic activity is significantly higher in 7PA2 compared with control cells. Blocking Aβ production with compound E restores mTOR activity (n = 9). For all the experiments shown here, cells were grown in triplicate in three independent experiments; thus, we analyzed a total of 9 samples for each cell line. Data are presented as mean ± S.E. Protein levels are expressed as arbitrary units. * indicates p < 0.05; ** indicates p < 0.01.
FIGURE 2.
FIGURE 2.
Rapamycin reduces Aβ levels in 7AP2 cells. A, representative Western blots of proteins extracted from 7PA2 cells treated with different concentrations of rapamycin for 24 h. B, densitometric analysis of the blots (normalized to β-actin) shows that rapamycin had no effect on total p70S6K levels but completely blocked phosphorylation of p70S6K at Thr389 (n = 9; horizontal line). C, rapamycin rescued the increased mTOR enzymatic activity in 7PA2 cells (n = 9). The horizontal line shows the levels of mTOR activity in control. D, sandwich ELISA measurements of proteins extracted from 7PA2 cells treated with rapamycin show that at all concentrations used, rapamycin significantly decreased the Aβ42 levels (n = 9). All the experiments shown here were done in triplicates in three independent experiments; thus, we analyzed a total of 9 samples for each cell line, for each specific condition. Data are presented as mean ± S.E. Protein levels are expressed as arbitrary units. * indicates p < 0.05; ** indicates p < 0.01.
FIGURE 3.
FIGURE 3.
mTOR signaling is increased in the cortex and hippocampus of 3xTg-AD mice. A, representative Western blots of protein extracted from the hippocampus of 6- and 12-month-old 3xTg-AD and non-Tg mice and probed for total and phospho-mTOR and p70S6K. B, densitometric analysis (normalized to β-actin) shows that at both ages the levels of total and phospho-mTOR and total p70S6K were similar between 3xTg-AD and non-Tg mice. In contrast, the levels of phosphorylated p70S6K are significantly higher in 3xTg-AD mice compared with age- and gender-matched non-Tg mice (6 mice per each genotype were analyzed). C, representative Western blots of protein extracted from the cortex of 6- and 12-month-old 3xTg-AD and non-Tg mice and probed for total and phospho-mTOR and p70S6K. D, densitometric analysis of the blots (normalized to β-actin) shows that at both ages the levels of total and phospho-mTOR and total p70S6K were similar between 3xTg-AD and non-Tg mice. In contrast, the levels of phosphorylated p70S6K are significantly higher in 3xTg-AD mice compared with age- and gender-matched non-Tg mice (6 mice per each genotype were analyzed). E, representative Western blots of protein extracted from the cerebellum of 6- and 12-month-old 3xTg-AD and non-Tg mice and probed for total and phospho-mTOR and p70S6K. F, densitometric analysis of the blots (normalized to β-actin) shows that at both ages the levels of total and phospho-mTOR and total and phospho-p70S6K were similar between 3xTg-AD and non-Tg mice (6 mice per each genotype were analyzed). G–I, mTOR enzymatic activity was significantly increased in the cortex and hippocampus of 6- and 12-month-old 3xTg-AD mice compared with age- and gender-matched non-Tg mice. In contrast, no differences were detected in the cerebellum (6 mice/each genotype were analyzed). Data are presented as mean ± S.E. * indicates p < 0.01. Protein levels are expressed as arbitrary units.
FIGURE 4.
FIGURE 4.
Rapamycin rescues early learning and memory deficits in the 3xTg-AD mice. 3xTg-AD and non-Tg mice treated or untreated with rapamycin were evaluated in the spatial reference version of the Morris water maze. A, all groups showed significant improvements over the 5 days of training. However, the escape latency of 3xTg-AD mice on rapamycin after 5 days of training was significantly lower than the 3xTg-AD on the control diet (p = 0.044). B–D, reference memory, tested 24 h after the last training trial, was significantly improved in 3xTg-AD mice on the rapamycin diet compared with 3xTg-AD mice on the control diet in all probe-trial measurements conducted. Notably, the 3xTg-AD mice on rapamycin performed as well as the non-Tg groups. E and F, swimming speed and percentage of time spent floating was not significant across the four groups of mice. Data are presented as mean ± S.E. ** indicates p < 0.01.
FIGURE 5.
FIGURE 5.
Rapamycin restores mTOR signaling in the brains of the 3xTg-AD mice. A, representative Western blots probed for total and phosphorylated mTOR and p70S6K antibodies. B and C, densitometric analysis of the blots (normalized to β-actin) indicated, that while the levels of total and phospho-mTOR and the levels of total p70S6K were similar among all the groups, rapamycin restored the steady-state levels of phosphorylated p70S6K (n = 8/genotype/drug treatment). D, rapamycin administration significantly reduced mTOR enzymatic activity in both non-Tg and 3xTg-AD mice. Notably, mTOR activity in the rapamycin-treated 3xTg-AD mice was similar to non-Tg mice on the control food (n = 8/genotype/drug treatment). Data are presented as mean ± S.E. Protein levels are expressed as arbitrary units. * indicates p = 0.01. CTL, control.
FIGURE 6.
FIGURE 6.
Rapamycin reduces Aβ42 levels and deposition. A–D, representative microphotographs depicting CA1 pyramidal neurons of treated and untreated 3xTg-AD mice stained with an anti-Aβ42 antibody. Sections from 8 different 3xTg-AD mice on rapamycin were compared with sections from 8 different 3xTg-AD on the control diet. Panels C and D are higher magnification views of panels A and B, respectively. E, rapamycin selectively decreased soluble Aβ42 levels as measured by sandwich ELISA. Proteins were obtained from 8 different 3xTg-AD mice on rapamycin and 8 different 3xTg-AD mice on the control diet. Data are presented as mean ± S.E. Scale bar is 100 μm for A and B and 12.5 μm for C and D. * indicates p = 0.02.
FIGURE 7.
FIGURE 7.
Rapamycin administration significantly decreases Tau pathology. A and B, representative microphotographs of CA1 pyramidal neurons stained with the anti-Tau antibody AT270, which recognizes Tau phosphorylated at Thr181, clearly indicate a decrease in AT270 immunoreactivity in mice treated with rapamycin. Sections from 8 different 3xTg-AD mice on rapamycin were compared with sections from 8 different 3xTg-AD mice on the control diet. C and D, serial sections from those shown in panels A and B were stained with the conformational-specific anti-Tau antibody MC1. Note the lack of MC1-positive neurons in the treated mice, where only background staining was detected. Sections from 8 different 3xTg-AD mice on rapamycin were compared with sections from 8 different 3xTg-AD mice on the control diet. E, representative Western blots of protein extracted from brains of 3xTg-AD mice and probed with the phospho-specific, anti-Tau antibody AT270 and with β-actin as a loading control. F, densitometric analysis of the blots (normalized to β-actin) indicates that rapamycin significantly reduced the steady-state levels of phosphorylated Tau at Thr181 (p = 0.006). Proteins were obtained from 8 different 3xTg-AD mice on rapamycin and 8 different 3xTg-AD mice on the control diet. G, ELISA measurements show that the levels of soluble Tau were significantly reduced in the brains of rapamycin-treated mice (p = 0.01). No changes were detected for insoluble Tau levels (p > 0.05). Proteins were obtained from 8 different 3xTg-AD mice on rapamycin and 8 different 3xTg-AD mice on the control diet. Data are presented as mean ± S.E. Scale bar is 100 μm for A and B and 400 μm for C and D. CTL, control.
FIGURE 8.
FIGURE 8.
APP and Tau expression levels are not affected by rapamycin. A, representative Western blots of proteins extracted from the brains of treated and untreated 3xTg-AD mice. B, densitometric analysis of the blots (normalized to β-actin) indicates that the steady-state levels of APP and the two major C-terminal fragments (C99 and C83) were not altered by rapamycin. C, similarly, the steady-state levels of the human Tau transgene remained unchanged after rapamycin administration. For the experiments presented here, proteins were obtained from 8 different 3xTg-AD mice on rapamycin and 8 different 3xTg-AD mice on the control diet (CTRL). Data are presented as mean ± S.E. Protein levels are expressed as arbitrary units.
FIGURE 9.
FIGURE 9.
Rapamycin increases autophagy induction. A, representative Western blots of proteins extracted from the brains of treated and untreated 3xTg-AD mice. B and C, densitometric analysis of the blots (normalized to β-actin) indicates that rapamycin significantly increased the steady-state levels of Atg7 and the Atg5·Atg12 complex. D and E, although rapamycin did not change the levels of LC3I, it significantly increased the steady-state levels of LC3II. F and G, confocal microscopy analysis of sections from 3xTg-AD-treated mice shows that both Tau and Aβ co-localize with the lysosomal protein Lamp2A. Proteins and brain sections used for the data presented here were obtained from 8 different 3xTg-AD mice on rapamycin and 8 different 3xTg-AD mice on the control diet. Data are presented as mean ± S.E. Protein levels are expressed as arbitrary units. * indicates p < 0.01; ** indicates p < 0.05.
FIGURE 10.
FIGURE 10.
Autophagy is necessary for the rapamycin-mediated decrease in Aβ levels. 7PA2 cells were treated with various concentrations of rapamycin as indicated for 24 h. At the end of the treatment, proteins were extracted and soluble Aβ42 levels were measured by ELISA. Although rapamycin administration significantly decreased Aβ42 levels (p < 0.05), blocking autophagy with 3-methyladenine (3-MA) prevented the rapamycin-induced decrease in Aβ42 levels. All experiments shown were done in triplicate in three independent experiments; thus, we analyzed a total of 9 samples for each cell line, for each specific condition. Data are presented as mean ± S.E.

Similar articles

Cited by

References

    1. Selkoe D. J. (2001) Physiol. Rev. 81, 741–766 - PubMed
    1. Goedert M., Wischik C. M., Crowther R. A., Walker J. E., Klug A. (1988) Proc. Natl. Acad. Sci. U.S.A. 85, 4051–4055 - PMC - PubMed
    1. Grundke-Iqbal I., Iqbal K., Tung Y. C., Quinlan M., Wisniewski H. M., Binder L. I. (1986) Proc. Natl. Acad. Sci. U.S.A. 83, 4913–4917 - PMC - PubMed
    1. Ihara Y., Nukina N., Miura R., Ogawara M. (1986) J. Biochem. 99, 1807–1810 - PubMed
    1. Kosik K. S., Joachim C. L., Selkoe D. J. (1986) Proc. Natl. Acad. Sci. U.S.A. 83, 4044–4048 - PMC - PubMed

Publication types

MeSH terms