Impaired glucose tolerance and predisposition to the fasted state in liver glycogen synthase knock-out mice
- PMID: 20178984
- PMCID: PMC2857087
- DOI: 10.1074/jbc.M110.106534
Impaired glucose tolerance and predisposition to the fasted state in liver glycogen synthase knock-out mice
Abstract
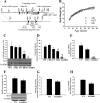
Conversion to glycogen is a major fate of ingested glucose in the body. A rate-limiting enzyme in the synthesis of glycogen is glycogen synthase encoded by two genes, GYS1, expressed in muscle and other tissues, and GYS2, primarily expressed in liver (liver glycogen synthase). Defects in GYS2 cause the inherited monogenic disease glycogen storage disease 0. We have generated mice with a liver-specific disruption of the Gys2 gene (liver glycogen synthase knock-out (LGSKO) mice), using Lox-P/Cre technology. Conditional mice carrying floxed Gys2 were crossed with mice expressing Cre recombinase under the albumin promoter. The resulting LGSKO mice are viable, develop liver glycogen synthase deficiency, and have a 95% reduction in fed liver glycogen content. They have mild hypoglycemia but dispose glucose less well in a glucose tolerance test. Fed, LGSKO mice also have a reduced capacity for exhaustive exercise compared with mice carrying floxed alleles, but the difference disappears after an overnight fast. Upon fasting, LGSKO mice reach within 4 h decreased blood glucose levels attained by control floxed mice only after 24 h of food deprivation. The LGSKO mice maintain this low blood glucose for at least 24 h. Basal gluconeogenesis is increased in LGSKO mice, and insulin suppression of endogenous glucose production is impaired as assessed by euglycemic-hyperinsulinemic clamp. This observation correlates with an increase in the liver gluconeogenic enzyme phosphoenolpyruvate carboxykinase expression and activity. This mouse model mimics the pathophysiology of glycogen storage disease 0 patients and highlights the importance of liver glycogen stores in whole body glucose homeostasis.
Figures


Similar articles
-
Increased glucose tolerance and reduced adiposity in the absence of fasting hypoglycemia in mice with liver-specific Gs alpha deficiency.J Clin Invest. 2005 Nov;115(11):3217-27. doi: 10.1172/JCI24196. Epub 2005 Oct 20. J Clin Invest. 2005. PMID: 16239968 Free PMC article.
-
Hepatic protein phosphatase 1 regulatory subunit 3B (Ppp1r3b) promotes hepatic glycogen synthesis and thereby regulates fasting energy homeostasis.J Biol Chem. 2017 Jun 23;292(25):10444-10454. doi: 10.1074/jbc.M116.766329. Epub 2017 May 4. J Biol Chem. 2017. PMID: 28473467 Free PMC article.
-
Mutations in the liver glycogen synthase gene in children with hypoglycemia due to glycogen storage disease type 0.J Clin Invest. 1998 Aug 1;102(3):507-15. doi: 10.1172/JCI2890. J Clin Invest. 1998. PMID: 9691087 Free PMC article.
-
A patient with glycogen storage disease type 0 and a novel sequence variant in GYS2: a case report and literature review.J Int Med Res. 2020 Aug;48(8):300060520936857. doi: 10.1177/0300060520936857. J Int Med Res. 2020. PMID: 32779500 Free PMC article. Review.
-
Hepatic glycogen synthase deficiency: an infrequently recognized cause of ketotic hypoglycemia.Mol Genet Metab. 2006 Apr;87(4):284-8. doi: 10.1016/j.ymgme.2005.10.006. Epub 2005 Dec 6. Mol Genet Metab. 2006. PMID: 16337419 Free PMC article. Review.
Cited by
-
The Source of Glycolytic Intermediates in Mammalian Tissues.Cell Metab. 2021 Feb 2;33(2):367-378.e5. doi: 10.1016/j.cmet.2020.12.020. Epub 2021 Jan 19. Cell Metab. 2021. PMID: 33472024 Free PMC article.
-
Ppp1r3b is a metabolic switch that shifts hepatic energy storage from lipid to glycogen.Sci Adv. 2025 May 16;11(20):eado3440. doi: 10.1126/sciadv.ado3440. Epub 2025 May 16. Sci Adv. 2025. PMID: 40378221 Free PMC article.
-
Pathway-selective insulin resistance and metabolic disease: the importance of nutrient flux.J Biol Chem. 2014 Jul 25;289(30):20462-9. doi: 10.1074/jbc.R114.576355. J Biol Chem. 2014. PMID: 24907277 Free PMC article. Review.
-
Diagnosis of hepatic glycogenosis in poorly controlled type 1 diabetes mellitus.World J Diabetes. 2014 Dec 15;5(6):882-8. doi: 10.4239/wjd.v5.i6.882. World J Diabetes. 2014. PMID: 25512791 Free PMC article. Review.
-
Leaf Extract from Lithocarpus polystachyus Rehd. Promote Glycogen Synthesis in T2DM Mice.PLoS One. 2016 Nov 28;11(11):e0166557. doi: 10.1371/journal.pone.0166557. eCollection 2016. PLoS One. 2016. PMID: 27893760 Free PMC article.
References
-
- Shulman G. I., Rothman D. L., Jue T., Stein P., DeFronzo R. A., Shulman R. G. (1990) N. Engl. J. Med. 322, 223–228 - PubMed
-
- Capaldo B., Gastaldelli A., Antoniello S., Auletta M., Pardo F., Ciociaro D., Guida R., Ferrannini E., Saccà L. (1999) Diabetes 48, 958–966 - PubMed
-
- Roach P. J. (2002) Curr. Mol. Med. 2, 101–120 - PubMed
Publication types
MeSH terms
Substances
Grants and funding
LinkOut - more resources
Full Text Sources
Molecular Biology Databases

