Comparative Study
. 2010 Jul;12(7):631-44.
doi: 10.1093/neuonc/noq001. Epub 2010 Feb 23.

Systemic immune suppression in glioblastoma: the interplay between CD14+HLA-DRlo/neg monocytes, tumor factors, and dexamethasone

Affiliations
Comparative Study

Systemic immune suppression in glioblastoma: the interplay between CD14+HLA-DRlo/neg monocytes, tumor factors, and dexamethasone

Michael P Gustafson et al. Neuro Oncol. 2010 Jul.

Abstract

Patients with glioblastoma (GBM) exhibit profound systemic immune defects that affect the success of conventional and immune-based treatments. A better understanding of the contribution of the tumor and/or therapy on systemic immune suppression is necessary for improved therapies, to monitor negative effects of novel treatments, to improve patient outcomes, and to increase understanding of this complex system. To characterize the immune profile of GBM patients, we phenotyped peripheral blood and compared these to normal donors. In doing so, we identified changes in systemic immunity associated with both the tumor and dexamethasone treated tumor bearing patients. In particular, dexamethasone exacerbated tumor associated lymphopenia primarily in the T cell compartment. We have also identified unique tumor and dexamethasone dependent altered monocyte phenotypes. The major population of altered monocytes (CD14(+)HLA-DR(lo/neg)) had a phenotype distinct from classical myeloid suppressor cells. These cells inhibited T cell proliferation, were unable to fully differentiate into mature dendritic cells, were associated with dexamethasone-mediated changes in CCL2 levels, and could be re-created in vitro using tumor supernatants. We provide evidence that tumors express high levels of CCL2, can contain high numbers of CD14(+) cells, that tumor supernatants can transform CD14(+)HLA-DR(+) cells into CD14(+)HLA-DR(lo/neg) immune suppressors, and that dexamethasone reduces CCL2 in vitro and is correlated with reduction of CCL2 in vivo. Consequently, we have developed a model for tumor mediated systemic immune suppression via recruitment and transformation of CD14(+) cells.


Figures
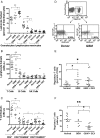
Fig. 1.
Fig. 1.
Systemic immune suppression in GBM patients is exacerbated by DEX. Analysis of peripheral blood immunophenotypes from normal donors (normal; filled circles) GBM patients (open circles) or GBM patients on DEX (GBM + DEX; triangles) by flow cytometry. (A) Percentage of major leukocyte subsets (granulocytes, lymphocytes, and monocytes) by gating on size and granularity (forward scatter vs side scatter). (B) Absolute counts (cells per microliter) of CD45+ lymphocytes including T cells (CD3+), B cells (CD3CD19+), NK cells (CD3CD16+CD56+). (C) Absolute counts (cells per microliter) of CD4+, CD45RA+ naïve, and CD45RO+ memory CD8+ cells. (D) Gating strategy for CD4+/CD25+/CD127lo Regulatory T cells. Representative dot plots are shown. CD4 positive lymphocytes were further subgrouped for CD25 and CD127. Regulatory T cells were reported by calculating them as a percent of total CD4 cells (E) and an absolute number (F) after multiplying the percent of Tregs per CD4 population by the number of CD4 cells counted per microliter in (C). Line in each column represents the mean with comparisons between sets indicated by brackets with * representing P < .05 and **P < .0001.
Fig. 2.
Fig. 2.
DEX contributes to abnormal monocyte phenotype in GBM. Monocytes from whole blood were phenotyped by flow cytometry. (A) Percentage of Lineageneg /HLA-DRneg/CD33+ MDSCs as a percentage of total mononuclear cells and CD16+ monocytes as a percentage of total monocytes in normal donors (filled squares) and GBM patients (open squares). (B) CD80 and CD86 costimulatory molecule expression as a percentage of the cells in the monocyte forward and side scatter gate. Percentage of CD14+/HLA-DRneg monocytes vs total CD14+ monocytes (in red). Normal donors are shown as filled circles, GBM patients not receiving DEX treatment as open circles, and those patients receiving DEX as open triangles. (C) Dot plots showing HLA-DR gating strategy. Gated monocytes (FSC vs SSC) were plotted as FSC vs CD14. CD14+ gated monocytes were plotted against HLA-DR. (D) Correlation between CD80 expression on monocytes and HLA-DR negative monocytes. Lines represent the mean with comparisons in brackets where * indicates significant difference (P < .05).
Fig. 3.
Fig. 3.
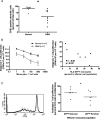
CD14+HLA-DRlo/neg monocytes suppress immune function. (A) Generation of mature DCs is decreased from monocytes of GBM patients (open circles) compared with that of healthy donors (filled circles). (B) Monocytes from GBM patients (circles) have decreased capacity to stimulate T cell proliferation compared with healthy donors (squares) in MLR (left panel). This reduced capacity is inversely correlated with the percent of HLA-DRlo/neg monocytes (right panel; 1:10 monocytes:T cell ratio). (C) HLA-DRlo/neg enriched monocytes from healthy donors (black) inhibited autologous T cell proliferation compared with the HLA-DRlo/neg reduced monocyte population (Gray; Left panel, histogram of T cell CFSE intensity from one donor). Percent of T cells going into proliferation from three healthy donors is shown on the right panel (* P < .05 for all panels).
Fig. 4.
Fig. 4.
GBM and DEX-derived effect on monocytes from healthy donors. (A) HLA-DR expression on monocytes increased after culture in media with DEX (square) compared with media alone (circle). (B) Compared with culture with media alone (circle), HLA-DR expression on monocytes were not changed with supernatants (square) from NHA (top panel) but decreased with supernatants from cultures of patients' primary tumors (top panel) and GBM cell lines (bottom panel). (C) Culture with supernatant of U373 with DEX further decreased monocytes HLA-DR expression. (D) Monocytes cultured in supernatants from U373 (TS) or U373 with 0.1 µM DEX (TSD) have decreased capacity to stimulate T cell proliferation in MLR compared with those cultured in media alone, media with 0.1 µM DEX, or NHA supernatant (top panel). Mature DC generation is shown on the bottom panel for the same supernatant conditions (for both panels, n = 3; * P < .05 between labeled condition and Media; ** P < .05 between labeled condition and Media + DEX.).
Fig. 5.
Fig. 5.
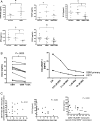
Secretion of monocyte-affecting cytokines and growth factors are altered by tumor derived factors and DEX. (A) Plasma samples of peripheral whole blood were analyzed for cytokines and growth factors using the 22-Plex (Upstate) kit or ELISA. Cytokines with significant differences are shown. Normals donors are represented in filled circles, GBM patients in open circles, and GBM patients receiving DEX in open triangles. For RANTES samples, all GBM patients were grouped together. (B) Analysis of cell culture supernatants from primary and established GBM cell lines grown in the presence or absence in DEX. Each point to point connection represents paired samples prior to or after treatment with 0.1 µM DEX for 72 hours. One primary GBM cell line and one established GBM cell line, U373, were also subjected to various doses of DEX treatment. A representative experiment is shown. (C) Correlation between DEX dose, CD14+HLA-DRlo/neg monocytes, and plasma CCL2. * indicates significant difference (P < .05).
Fig. 6.
Fig. 6.
CD14+ monocytes are found in GBM tumors and their presence correlates to CCL2 expression by tumors. TMAs spotted with GBM tumors were stained with an antihuman CD14 antibody and an identical array stained with CCL2 antibody. (A) An example of a GBM tumor showing high CD14 staining, high CCL2 staining. (B) An example of a GBM tumor showing moderate CD14 staining and high CCL2 staining. (C) An example of a GBM tumor from showing both low CD14 and CCL2 staining. (D) CD14 and CCL2 staining of human brain gliosis.
Fig. 7.
Fig. 7.
Proposed model of GBM induced immunosuppression by CD14+HLA-DRlo/neg monocytes. In GBM, tumor derived factors like CCL2 recruit CD14+ cells to the tumor environment whereby they are exposed to tumor derived factors and other immunosuppressive cytokines. Subsequently, CD14+HLA-DR+ monocytes become CD14+HLA-DRlo/neg monocytes. DEX down-regulates specific cytokine expression within the tumor (like CCL2), thus inhibiting the recruitment of monocytes to the tumor or releasing of CD14+HLA-DRlo/neg monocytes from the tumor microenvironment into the bloodstream (upper panel). Under normal conditions, CD14+HLA-DR+ monocytes differentiate into mature DCs and activate responder T cells. CD14+HLA-DRlo/neg monocytes are unable to fully differentiate into mature DCs and also directly inhibit T cell responses.

Similar articles

Cited by

References

    1. Stupp R, Mason WP, van den Bent MJ, et al. Radiotherapy plus concomitant and adjuvant temozolomide for glioblastoma. N Engl J Med. 2005;352:987–996. - PubMed
    1. Emens LA, Jaffe EM. Leveraging the activity of tumor vaccines with cytotoxic chemotherapy. Cancer Res. 2005;65:8059–8064. - PubMed
    1. Gustafson MP, Knutson KL, Dietz AB. Therapeutic vaccines for malignant brain tumors. Biologics. 2008;2(4):753–761. - PMC - PubMed
    1. Haynes NM, van der Most RG, Lake RA, Smyth MJ. Immunogenic anti-cancer chemotherapy as an emerging concept. Curr Opin Immunol. 2008;20:1–13. - PubMed
    1. Brooks WH, Roszman TL, Mahaley MS, Woosley RE. Immunobiology of primary intracranial tumors: II. Analysis of lymphocyte subpopulations in patients with primary brain tumors. Clin Exp Immunol. 1977;29:61–66. - PMC - PubMed

Publication types

MeSH terms