Educational inequalities in mortality over four decades in Norway: prospective study of middle aged men and women followed for cause specific mortality, 1960-2000
- PMID: 20179132
- PMCID: PMC2827714
- DOI: 10.1136/bmj.c654
Educational inequalities in mortality over four decades in Norway: prospective study of middle aged men and women followed for cause specific mortality, 1960-2000
Erratum in
- BMJ. 2010;340:c1803
Abstract
Objectives: To determine the extent to which educational inequalities in relation to mortality widened in Norway during 1960-2000 and which causes of death were the main drivers of this disparity.
Design: Nationally representative prospective study.
Setting: Four cohorts of the Norwegian population aged 45-64 years in 1960, 1970, 1980, and 1990 and followed up for mortality over 10 years.
Participants: 359 547 deaths and 32 904 589 person years.
Main outcome measures: All cause mortality and deaths due to cancer of lung, trachea, or bronchus; other cancer; cardiovascular diseases; suicide; external causes; chronic lower respiratory tract diseases; or other causes. Absolute and relative indices of inequality were used to present differences in mortality by educational level (basic, secondary, and tertiary).
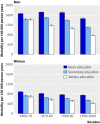
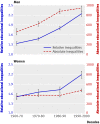
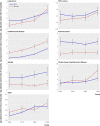
Results: Mortality fell from the 1960s to the 1990s in all educational groups. At the same time the proportion of adults in the basic education group, with the highest mortality, decreased substantially. As mortality dropped more among those with the highest level of education, inequalities widened. Absolute inequalities in mortality denoting deaths among the basic education groups minus deaths among the high education groups doubled in men and increased by a third in women. This is equivalent to an increase in the slope index of inequality of 105% in men and 32% in women. Inequalities on a relative scale widened more, from 1.33 to 2.24 among men (P=0.01) and from 1.52 to 2.19 among women (P=0.05). Among men, absolute inequalities mainly increased as a result of cardiovascular diseases, lung cancer, and chronic lower respiratory tract diseases. Among women this was mainly due to lung cancer and chronic lower respiratory tract diseases. Unlike the situation in men, absolute inequalities in deaths due to cardiovascular causes narrowed among women. Chronic lower respiratory tract diseases contributed more to the disparities in inequalities among women than among men.
Conclusion: All educational groups showed a decline in mortality. Nevertheless, and despite the fact that the Norwegian welfare model is based on an egalitarian ideology, educational inequalities in mortality among middle aged people in Norway are substantial and increased during 1960-2000.
Conflict of interest statement
Competing interests: None declared.
Figures


Comment in
-
Intelligence, education, and mortality.BMJ. 2010 Apr 27;340:c563. doi: 10.1136/bmj.c563. BMJ. 2010. PMID: 20423976 No abstract available.
References
-
- Mackenbach JP, Bos V, Andersen O, Cardano M, Costa G, Harding S, et al. Widening socioeconomic inequalities in mortality in six Western European countries. Int J Epidemiol 2003;32:830-7. - PubMed
-
- Fawcett J, Blakely T, Kunst A. Are mortality differences and trends by education any better or worse in New Zealand? A comparison study with Norway, Denmark and Finland, 1980-1990s. Eur J Epidemiol 2005;20:683-91. - PubMed
-
- Rognerud MA, Zahl PH. Social inequalities in mortality: changes in the relative importance of income, education and household size over a 27-year period. Eur J Public Health 2006;16:62-8. - PubMed
Publication types
MeSH terms
LinkOut - more resources
Full Text Sources
Research Materials
