. 2010 Feb;22(2):508-22.
doi: 10.1105/tpc.109.068874. Epub 2010 Feb 23.

PEPR2 is a second receptor for the Pep1 and Pep2 peptides and contributes to defense responses in Arabidopsis

Affiliations

PEPR2 is a second receptor for the Pep1 and Pep2 peptides and contributes to defense responses in Arabidopsis

Yube Yamaguchi et al. Plant Cell. 2010 Feb.

Abstract

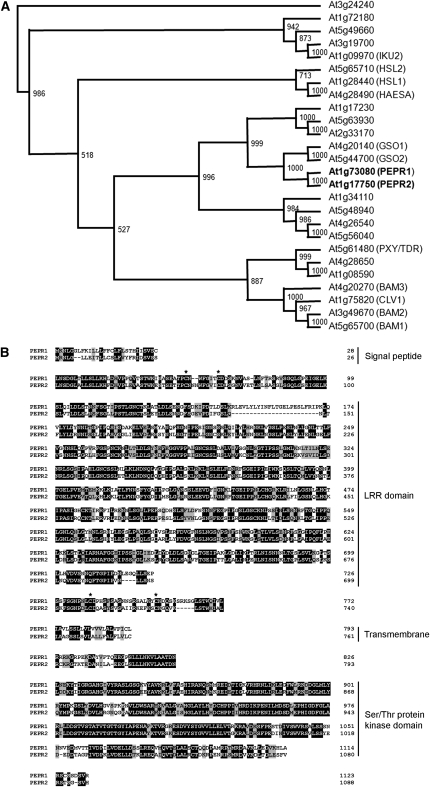
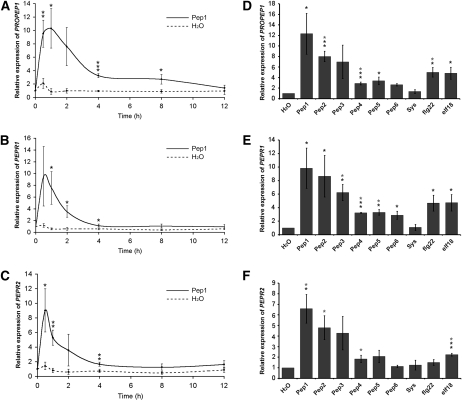
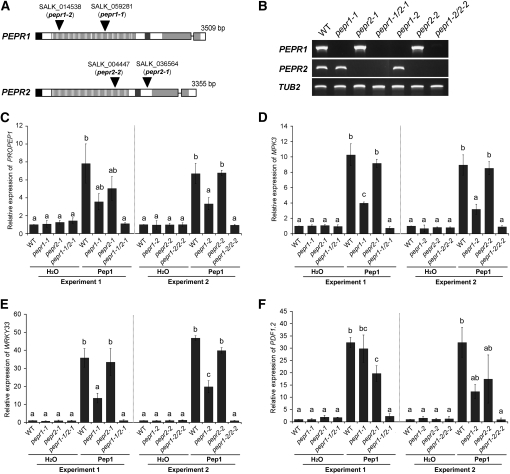
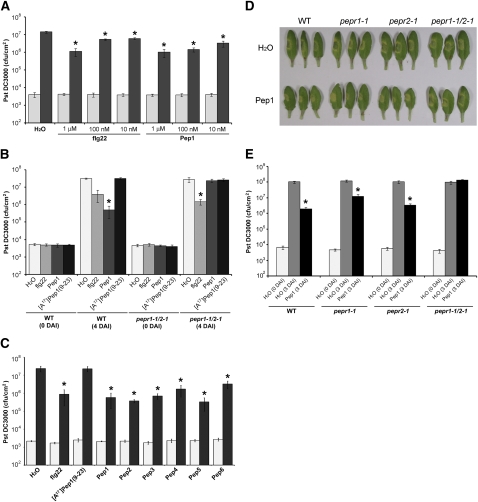
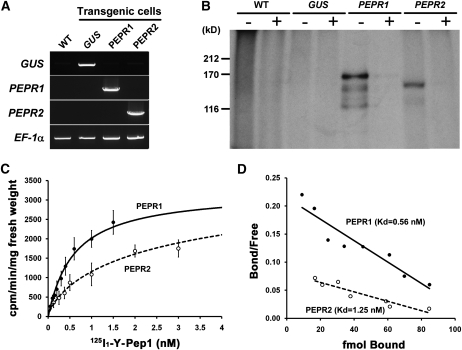
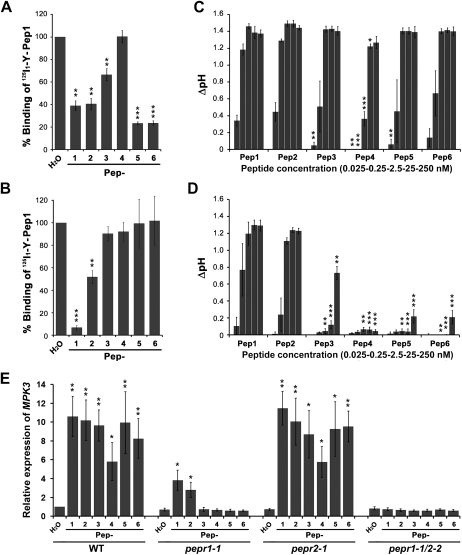
Pep1 is a 23-amino acid peptide that enhances resistance to a root pathogen, Pythium irregulare. Pep1 and its homologs (Pep2 to Pep7) are endogenous amplifiers of innate immunity of Arabidopsis thaliana that induce the transcription of defense-related genes and bind to PEPR1, a plasma membrane leucine-rich repeat (LRR) receptor kinase. Here, we identify a plasma membrane LRR receptor kinase, designated PEPR2, that has 76% amino acid similarity to PEPR1, and we characterize its role in the perception of Pep peptides and defense responses. Both PEPR1 and PEPR2 were transcriptionally induced by wounding, treatment with methyl jasmonate, Pep peptides, and pathogen-associated molecular patterns. The effects of Pep1 application on defense-related gene induction and enhancement of resistance to Pseudomonas syringae pv tomato DC3000 were partially reduced in single mutants of PEPR1 and PEPR2 and abolished completely in double mutants. Photoaffinity labeling and binding assays using transgenic tobacco (Nicotiana tabacum) cells expressing PEPR1 and PEPR2 clearly demonstrated that PEPR1 is a receptor for Pep1-6 and that PEPR2 is a receptor for Pep1 and Pep2. Our analysis demonstrates differential binding affinities of two receptors with a family of peptide ligands and the corresponding physiological effects of the specific receptor-ligand interactions. Therefore, we demonstrate that, through perception of Peps, PEPR1 and PEPR2 contribute to defense responses in Arabidopsis.


Figures

Figure 1.
Figure 1.
Phylogenetic Analysis of the LRR XI Subfamily of Arabidopsis LRR Receptor Protein Kinases. (A) The phylogenetic relationships of the LRR XI subfamily of Arabidopsis LRR receptor protein kinases. The phylogenetic relationships (unrooted) were analyzed using the ClustalW program (see Supplemental Data Set 1 online) and the PHYLIP program using full-length amino acid sequences and visualized by the TreeView program. The numbers on the branches indicate the bootstrap value calculated from 1000 bootstrap sets. The LRR receptor protein kinases with known biological function are indicated on the right. (B) The amino acid sequence alignment of PEPR1 and PEPR2 using the ClustalW program. Identical amino acid residues are shaded black, and similar residues are shaded gray using the BioEdit program. Predicted protein domains are indicated on the right side and the two Cys pairs are indicated by asterisks.
Figure 2.
Figure 2.
Transcriptional Induction of PEPR1 and PEPR2 by Wounding and MeJA in 4-Week-Old Arabidopsis. (A) and (B) Relative expression of PEPR1 (A) and PEPR2 (B) in wounded leaves and unwounded upper leaves. Error bars indicate se from four independent experiments. The number of asterisks indicates samples that are significantly different from corresponding samples at 0 h (t test: one asterisk, P < 0.05; two asterisks, P < 0.02; three asterisks, P < 0.01). (C) and (D) Relative expression of PEPR1 (C) and PEPR2 (D) after MeJA and water spraying. Error bars indicate se from five independent experiments. The number of asterisks indicates samples that are significantly different from corresponding samples sprayed with water (t test: one asterisk, P < 0.05; two asterisks, P < 0.02; three asterisks, P < 0.01).
Figure 3.
Figure 3.
The Effect of Supplying Various Peptides to Wild-Type Arabidopsis Plants on Transcription of Target Genes. (A) to (C) Two-week-old Arabidopsis seedlings grown in liquid medium were incubated with either Pep1 (10 nM) or water for the indicated time period, and the expression patterns of PROPEP1 (A), PEPR1 (B), and PEPR2 (C) were analyzed by qRT-PCR. Expression levels are indicated relative to the expression at 0 h. (D) to (F) Two-week-old Arabidopsis seedlings grown in liquid medium were incubated with 10 nM Pep1, Pep2, Pep3, Pep4, Pep5, Pep6, tomato systemin (Sys), flg22, or elf18, and the expression of PROPEP1 (D), PEPR1 (E), and PEPR2 (F) was analyzed after 1 h by qRT-PCR. Expression levels are indicated relative to the expression in water supplying seedlings. Error bars indicate se from three different experiments. The number of asterisks indicates samples that are significantly different from corresponding samples at 0 h or supplied with water (t test: one asterisk, P < 0.05; two asterisks, P < 0.02; three asterisks, P < 0.005).
Figure 4.
Figure 4.
Analysis of the T-DNA Mutants in PEPR1 and PEPR2. (A) T-DNA insertion sites in the PEPR1 and PEPR2 genes are indicated by black triangles. Black regions represent the signal peptides, dark-gray regions represent transmembrane domains, light-gray regions represent the kinase domains, and striped regions represent the LRR domain. (B) RT-PCR analysis of the PEPR1 and PEPR2 transcripts in wild-type and T-DNA insertional mutants. The T-DNA mutants from (A) were analyzed along with two double mutants (pepr1-1 pepr2-1 and pepr1-2 pepr2-2). β-TUBULIN (TUB2) gene was amplified as an internal control. (C) to (E) The effect of Pep1 on the expression patterns of the early response genes PROPEP1, MPK3, and WRKY33, respectively, for the T-DNA mutants. Two-week-old Arabidopsis seedlings grown in liquid medium were incubated with 10 nM Pep1 for 30 min, and the expression was analyzed by qRT-PCR. (F) The effect of Pep1 on the expression pattern of the late response gene PDF1.2 for the T-DNA mutants. Four-week-old Arabidopsis plants grown in soil were sprayed with 1 μM Pep1 in 0.01% Silwet L-77, and total RNA was extracted after 6 h. The expression was analyzed by qRT-PCR. Expression levels are indicated relative to expression in wild-type seedlings supplied with water. Error bars indicate se from three different experiments. The letters indicate groupings by the one-way analysis of variance with Tukey multiple comparison test (P < 0.05).
Figure 5.
Figure 5.
P. syringae pv Tomato DC3000 (Pst DC3000) Infection Assay of Wild-Type Arabidopsis and T-DNA Mutants Pretreated with Peptides. (A) Pst DC3000 proliferation in wild-type plants with flg22 and Pep1. Light-gray bars and dark-gray bars indicate samples just after inoculation and 4 d after inoculation (DAI), respectively. Values presented are the average ± se from three independent experiments. The asterisks indicate samples that are significantly different from the sample supplied with water (t test, P < 0.02). cfu, colony-forming units. (B) Pst DC3000 proliferation in wild-type and pepr1-1 pepr2-1 plants with flg22 (1 μM), Pep1 (1 μM), and [A17] Pep1(9-23) (1 μM). Values presented are the average ± se from three independent experiments. The asterisks indicate samples that are significantly different from corresponding samples supplied with water (t test, P < 0.02). (C) Pst DC3000 proliferation in wild-type plants with indicated peptides (1 μM). Light-gray bars and dark-gray bars indicate samples just after inoculation and 4 d after inoculation, respectively. Values presented are the average ± se from three independent experiments. The asterisks indicate samples that are significantly different from the sample supplied with water (t test, P < 0.04). (D) Symptoms of the wild type, pepr1-1, pepr2-1, and pepr1-1 pepr2-1 preinfiltrated with water or Pep1 (1 μM) 4 d after infection with Pst DC3000. (E) Pst DC3000 proliferation in the wild type, pepr1-1, pepr2-1, and pepr1-1 pepr2-1 with or without Pep1. Values presented are the average ± se from nine plants from three independent experiments. The asterisks indicate samples that are significantly different from corresponding samples supplied with water (t test, P < 0.0008). In all experiments, peptides or water were infiltrated 1 d prior to infection.
Figure 6.
Figure 6.
Binding of Radiolabeled Pep1 to PEPR1- and PEPR2-Expressing Tobacco Cells. (A) Confirmation of transgene (GUS, PEPR1, and PEPR2) expression of transgenic tobacco cells by RT-PCR. The tobacco elongation factor 1α (EF-1α) gene was amplified as an internal reference transcript. (B) Photoaffinity labeling of transgenic tobacco cells using 0.25 nM 125I-azido-Cys-Pep1 with or without 50 μM of unlabeled Pep1 as a competitor. Ten microliters of sample solution from wild-type, PEPR2, and GUS-expressing cells and 1 μL of a sample solution from PEPR1-expressing cells were separated by SDS-PAGE and exposed to x-ray film. (C) Saturation analysis of 125I1-Tyr-Pep1 binding to transgenic tobacco cells expressing PEPR1 and PEPR2. Error bars indicate se for three different experiments. (D) Scatchard analysis of the data from (C). The Kd is calculated as the negative inverse of the slope of the plot.
Figure 7.
Figure 7.
Binding Preference of PEPR1 and PEPR2 for Pep1-6. (A) and (B) Competition assay of Pep peptides with 125I1-Y-Pep1 (0.5 nM) for binding to transgenic tobacco cells expressing PEPR1 (A) and PEPR2 (B). Remaining specific binding of 125I1-Y-Pep1 to cells in the presence of unlabeled competitor peptide (Pep1-6) (10 nM) is indicated as a percentage of specific binding of 125I1-Y-Pep1 to the cells without competitor. (C) and (D) Medium alkalinization of transgenic tobacco cells expressing PEPR1 (C) and PEPR2 (D) by the Pep peptides, assayed at the five concentrations shown. (E) The effect of Pep peptides on the expression pattern of MPK3 gene for the T-DNA mutants. Two-week-old Arabidopsis seedlings grown in liquid medium were incubated with 10 nM peptide for 30 min, and the expression was analyzed by qRT-PCR. Expression levels are indicated relative to the expression in wild-type seedlings supplied with water. Error bars indicate se for three ([A] to [D]) and five (E) different experiments. The number of asterisks indicates samples that are significantly different from corresponding samples supplied with water ([A], [B], and [E]) and with Pep1 ([C] and [D]) (t test: one asterisk, P < 0.05; two asterisks, P < 0.01; three asterisks, P < 0.001).

References

    1. Asai T., Tena G., Plotnikova J., Willmann M.R., Chiu W.L., Gomez-Gomez L., Boller T., Ausubel F.M., Sheen J. (2002). MAP kinase signalling cascade in Arabidopsis innate immunity. Nature 415: 977–983 - PubMed
    1. Bendtsen J.D., Nielsen H., von Heijne G., Brunak S. (2004). Improved prediction of signal peptides: SignalP 3.0. J. Mol. Biol. 340: 783–795 - PubMed
    1. Boller T., Felix G. (2009). A renaissance of elicitors: perception of microbe-associated molecular patterns and danger signals by pattern-recognition receptors. Annu. Rev. Plant Biol. 60: 379–406 - PubMed
    1. Chinchilla D., Bauer Z., Regenass M., Boller T., Felix G. (2006). The Arabidopsis receptor kinase FLS2 binds flg22 and determines the specificity of flagellin perception. Plant Cell 18: 465–476 - PMC - PubMed
    1. Cho S.K., Larue C.T., Chevalier D., Wang H., Jinn T.L., Zhang S., Walker J.C. (2008). Regulation of floral organ abscission in Arabidopsis thaliana. Proc. Natl. Acad. Sci. USA 105: 15629–15634 - PMC - PubMed

Publication types

MeSH terms