. 2010 Jul;24(7):2235-44.
doi: 10.1096/fj.09-132324. Epub 2010 Feb 23.

Sequence-specific targeting of IGF-I and IGF-IR genes by camptothecins

Affiliations

Sequence-specific targeting of IGF-I and IGF-IR genes by camptothecins

Kahina Oussedik et al. FASEB J. 2010 Jul.

Abstract

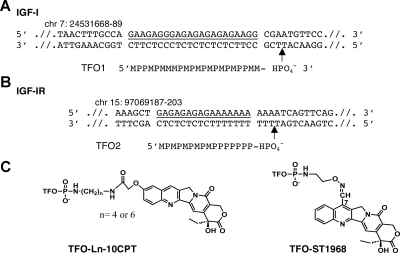
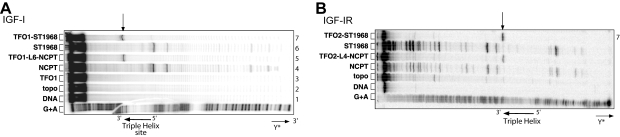
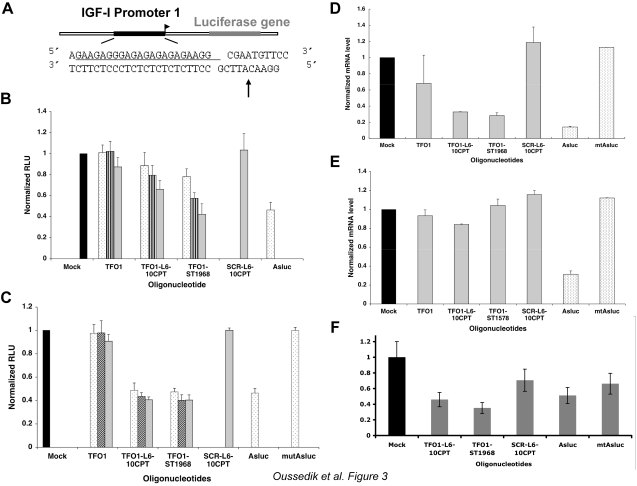
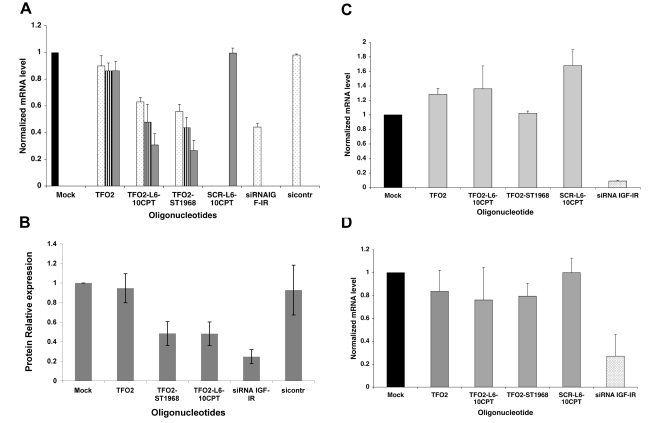
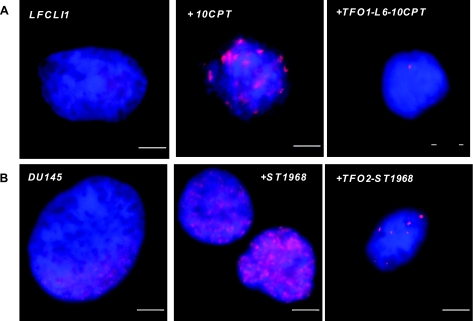
We and others have clearly demonstrated that a topoisomerase I (Top1) inhibitor, such as camptothecin (CPT), coupled to a triplex-forming oligonucleotide (TFO) through a suitable linker can be used to cause site-specific cleavage of the targeted DNA sequence in in vitro models. Here we evaluated whether these molecular tools induce sequence-specific DNA damage in a genome context. We targeted the insulin-like growth factor (IGF)-I axis and in particular promoter 1 of IGF-I and intron 2 of type 1 insulin-like growth factor receptor (IGF-IR) in cancer cells. The IGF axis molecules represent important targets for anticancer strategies, because of their central role in oncogenic maintenance and metastasis processes. We chemically attached 2 CPT derivatives to 2 TFOs. Both conjugates efficiently blocked gene expression in cells, reducing the quantity of mRNA transcribed by 70-80%, as measured by quantitative RT-PCR. We confirmed that the inhibitory mechanism of these TFO conjugates was mediated by Top1-induced cleavage through the use of RNA interference experiments and a camptothecin-resistant cell line. In addition, induction of phospho-H2AX foci supports the DNA-damaging activity of TFO-CPT conjugates at specific sites. The evaluated conjugates induce a specific DNA damage at the target gene mediated by Top1.


Figures

Figure 1.
Figure 1.
A) Sequence of TFO1 and the rat IGF-I promoter 1 DNA target (underscored) used in this study. B) Sequence of the target region in intron 2 of human IGF-IR. TFO2 is directed against a 16-bp sequence (underscored). TFOs bind in the major groove, parallel to the oligopurine strand of the duplex M, 5-methyl-2′-deoxycytidine and P, 5-propynyl-2′-deoxyuridine. Positions on the genomes are annotated (Ensembl Release 48). Arrows indicate the cleavage site induced by the conjugates. C) Chemical structures of the camptothecin conjugates.
Figure 2.
Figure 2.
Sequence analysis of the Top1-mediated cleavage products of IGF-I and IGF-IR. Duplexes were radiolabeled on the 3′-end of the oligopyrimidine-containing strand. Adenine/guanine lane (G+A) corresponds to Maxam-Gilbert sequencing. Arrows indicate positions of cleavage sites. A) IGF-I: lane 1, duplex alone; lane 2, duplex incubated with Top1; lane 3, duplex incubated with Top1 in the presence of 1 μM TFO; lane 4, 10 μM 10CPT; lane 5, 1 μM TFO1-L6-10CPT; lane 6, 10 μM ST1968; lane 7, 1 μM TFO1-ST1968. B) IGF-IR: lane 2, duplex alone; lane 3, duplex incubated with Top1; lane 4, duplex incubated with Top1 in the presence of 10 μM 10CPT; lane 5, 1 μM TFO2-L4-10CPT; lane 6, 10 μM ST1968; lane 7, 1 μM TFO2-ST1968.
Figure 3.
Figure 3.
Cellular activity of the IGF-I conjugates. A) Experimental construction in rat hepatocellular carcinoma cell line. B) Activity 24 h after transfection. LFCLI1 cells (black bars) were transfected with the oligonucleotides at 100 nM (dotted bars), 500 nM (hatched bars), or 1000 nM (gray bars) using Nanofectin. Relative luciferase activity is expressed as light units normalized to total protein amount and to the untreated cells. Values are means ± sd (error bars) from 3 independent experiments. C) Activity 72 h after transfection. D) Measurement of luciferase mRNA by qRT PCR at 1 μM (gray) of conjugates and 100 nM of antisense luciferase (Asluc) and mutated antisense luciferase (mtAsluc). Cells were analyzed 24 h after transfection, IGF-I signal was normalized to untreated cells and to β-glucuronidase (GUSB). Values are means ± sd from 3 independent experiments. E) Same experiment as in D except that cells were transfected with 100 nM siRNA directed against human Top1 72 h before transfection of the conjugates. F) Same experiment as in E except that cells were transfected with 100 nM siRNA control, 72 h before transfection of the conjugates.
Figure 4.
Figure 4.
A) Quantification of mRNA IGF-IR in DU145 cells. Conjugates (1 μM, gray bars; 0.5 μM, hatched bars; and 0.1 μM, dotted bars) and siRNAs (10 nM, dotted bars) were transfected into cells with Oligofectamine. mRNA quantity was measured 24 h after transfection. Experiments were run 4 times (means ± sd). IGF-IR signal was normalized to untreated cells and to the standard gene GUSB. B) Mean value of 3 experiments run in duplicate measuring IGF-IR protein levels 72 h after treatment with TFO2, TFO2-ST1968, TFO2-L6-10CPT, siRNA IGF-IR, and sicontr of DU145 cells transfected in the presence of Oligofectamine. Oligonucleotides were 1000 nM, except si was 10 nM. β-actin was used as an internal control. C) Quantification of mRNA IGF-IR in DU145RCI0.1 cells; transfections as in A. D) Quantification of mRNA IGF-IR in DU145 cells in presence of siRNA targeting Top1. Transfections as in A, but cells were first transfected with 100 nM Top1 siRNA 72 h before transfection of conjugates and controls.
Figure 5.
Figure 5.
Detection of γH2AX foci. Nucleus was revealed by DAPI staining (blue), and γH2AX foci were stained using rhodamine (red). A) Untreated LFCLI1 cells (left), LFCLI1 cells treated with 10CPT (1 μM, 2 h, middle), and LFCLI1 cells transfected with TFO1-L6-10CPT (1 μM, 24 h, right). B) DU145 cells (left), DU145 cells treated with ST1968 (1 μM, 2 h, middle), and DU145 cells transfected with TFO2-ST1968 (1 μM, 24 h, right). Nuclei from cells in G1 and G2 phases of the cell cycle show red signals as single spots or doublets, respectively. All nuclei were counterstained with DAPI to verify nuclear integrity before analysis. Scale bar = 5 μm.

Similar articles

Cited by

References

    1. Baserga The insulin-like growth factor-I receptor as a target for cancer therapy. Expert Opin Ther Targets. 2005;9:753–768. - PubMed
    1. Sachdev D, Yee D. Disrupting insulin-like growth factor signaling as a potential cancer therapy. Mol Cancer Ther. 2007;6:1–12. - PubMed
    1. Samani A A, Yakar S, LeRoith D, Brodt P. The role of the IGF system in cancer growth and metastasis: overview and recent insights. Endocr Rev. 2007;28:20–47. - PubMed
    1. Pollak M. Insulin and insulin-like growth factor signalling in neoplasia. Nat Rev Cancer. 2008;8:915–928. - PubMed
    1. Davies M, Gupta S, Goldspink G, Winslet M. The insulin-like growth factor system and colorectal cancer: clinical and experimental evidence. Int J Colorectal Dis. 2006;21:201–208. - PubMed

Publication types