Molecular profiling uncovers a p53-associated role for microRNA-31 in inhibiting the proliferation of serous ovarian carcinomas and other cancers
- PMID: 20179198
- PMCID: PMC2831102
- DOI: 10.1158/0008-5472.CAN-09-3875
Molecular profiling uncovers a p53-associated role for microRNA-31 in inhibiting the proliferation of serous ovarian carcinomas and other cancers
Abstract
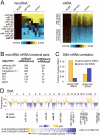
MicroRNAs (miRNA) regulate complex patterns of gene expression, and the relevance of altered miRNA expression to ovarian cancer remains to be elucidated. By comprehensively profiling expression of miRNAs and mRNAs in serous ovarian tumors and cell lines and normal ovarian surface epithelium, we identified hundreds of potential miRNA-mRNA targeting associations underlying cancer. Functional overexpression of miR-31, the most underexpressed miRNA in serous ovarian cancer, repressed predicted miR-31 gene targets including the cell cycle regulator E2F2. MIR31 and CDKN2A, which encode p14(ARF) and p16(INK4A), are located at 9p21.3, a genomic region commonly deleted in ovarian and other cancers. p14(ARF) promotes p53 activity, and E2F2 overexpression in p53 wild-type cells normally leads via p14(ARF) to an induction of p53-dependent apoptosis. In a number of serous cancer cell lines with a dysfunctional p53 pathway (i.e., OVCAR8, OVCA433, and SKOV3), miR-31 overexpression inhibited proliferation and induced apoptosis; however, in other lines (i.e., HEY and OVSAYO) with functional p53, miR-31 had no effect. Additionally, the osteosarcoma cell line U2OS and the prostate cancer cell line PC3 (p14(ARF)-deficient and p53-deficient, respectively) were also sensitive to miR-31. Furthermore, miR-31 overexpression induced a global gene expression pattern in OVCAR8 associated with better prognosis in tumors from patients with advanced stage serous ovarian cancer, potentially affecting many genes underlying disease progression. Our findings reveal that loss of miR-31 is associated with defects in the p53 pathway and functions in serous ovarian cancer and other cancers, suggesting that patients with cancers deficient in p53 activity might benefit from therapeutic delivery of miR-31.
Figures


Similar articles
-
[Expression and significance of microRNAs in the p53 pathway in ovarian cancer cells and serous ovarian cancer tissues].Zhonghua Zhong Liu Za Zhi. 2011 Dec;33(12):885-90. Zhonghua Zhong Liu Za Zhi. 2011. PMID: 22340095 Chinese.
-
Oncomir miR-125b suppresses p14(ARF) to modulate p53-dependent and p53-independent apoptosis in prostate cancer.PLoS One. 2013 Apr 9;8(4):e61064. doi: 10.1371/journal.pone.0061064. Print 2013. PLoS One. 2013. PMID: 23585871 Free PMC article.
-
Global miRNA expression analysis of serous and clear cell ovarian carcinomas identifies differentially expressed miRNAs including miR-200c-3p as a prognostic marker.BMC Cancer. 2014 Feb 11;14:80. doi: 10.1186/1471-2407-14-80. BMC Cancer. 2014. PMID: 24512620 Free PMC article.
-
Mutant p53 exerts oncogenic effects through microRNAs and their target gene networks.FEBS Lett. 2014 Aug 19;588(16):2610-5. doi: 10.1016/j.febslet.2014.03.054. Epub 2014 Apr 12. FEBS Lett. 2014. PMID: 24726728 Free PMC article. Review.
-
MicroRNAs in ovarian carcinomas.Endocr Relat Cancer. 2010 Jan 29;17(1):F77-89. doi: 10.1677/ERC-09-0203. Print 2010 Mar. Endocr Relat Cancer. 2010. PMID: 19903743 Free PMC article. Review.
Cited by
-
Epigenetic repression of miR-31 disrupts androgen receptor homeostasis and contributes to prostate cancer progression.Cancer Res. 2013 Feb 1;73(3):1232-44. doi: 10.1158/0008-5472.CAN-12-2968. Epub 2012 Dec 11. Cancer Res. 2013. PMID: 23233736 Free PMC article.
-
Concordant and discordant regulation of target genes by miR-31 and its isoforms.PLoS One. 2013;8(3):e58169. doi: 10.1371/journal.pone.0058169. Epub 2013 Mar 5. PLoS One. 2013. PMID: 23472152 Free PMC article.
-
MicroRNA-mediated gene regulations in human sarcomas.Cell Mol Life Sci. 2012 Nov;69(21):3571-85. doi: 10.1007/s00018-012-1127-x. Epub 2012 Aug 25. Cell Mol Life Sci. 2012. PMID: 22922987 Free PMC article. Review.
-
MicroRNA profiles discriminate among colon cancer metastasis.PLoS One. 2014 Jun 12;9(6):e96670. doi: 10.1371/journal.pone.0096670. eCollection 2014. PLoS One. 2014. PMID: 24921248 Free PMC article.
-
Clinical significance of circulating miR-25-3p as a novel diagnostic and prognostic biomarker in osteosarcoma.Oncotarget. 2017 May 16;8(20):33375-33392. doi: 10.18632/oncotarget.16498. Oncotarget. 2017. PMID: 28380419 Free PMC article.
References
-
- Seidman J, Horkayne-Szakaly I, Haiba M, Boice C, Kurman R, Ronnett B. The histologic type and stage distribution of ovarian carcinomas of surface epithelial origin. Int J Gynecol Pathol. 2004;23:41–4. - PubMed
-
- Bell D. Origins and molecular pathology of ovarian cancer. Mod Pathol. 2005;18(Suppl 2):S19–32. - PubMed
-
- Bonome T, Lee J, Park D, et al. Expression profiling of serous low malignant potential, low-grade, and high-grade tumors of the ovary. Cancer Res. 2005;65(22):10602–12. - PubMed
Publication types
MeSH terms
Substances
Grants and funding
- GM56929/GM/NIGMS NIH HHS/United States
- CA60651/CA/NCI NIH HHS/United States
- HHMI/Howard Hughes Medical Institute/United States
- R25 GM056929/GM/NIGMS NIH HHS/United States
- 2U54HG003273-05/HG/NHGRI NIH HHS/United States
- T32 GM008307/GM/NIGMS NIH HHS/United States
- K12 HD001426/HD/NICHD NIH HHS/United States
- K12HD01426-02/HD/NICHD NIH HHS/United States
- T32GM008307/GM/NIGMS NIH HHS/United States
- P30CA125123/CA/NCI NIH HHS/United States
- U54 HG003273/HG/NHGRI NIH HHS/United States
- R01 CA060651/CA/NCI NIH HHS/United States
- P30 CA125123/CA/NCI NIH HHS/United States
LinkOut - more resources
Full Text Sources
Other Literature Sources
Medical
Molecular Biology Databases
Research Materials
Miscellaneous

