. 2010 Jun;298(6):E1097-114.
doi: 10.1152/ajpendo.00780.2009. Epub 2010 Feb 23.

Mice deficient in group VIB phospholipase A2 (iPLA2gamma) exhibit relative resistance to obesity and metabolic abnormalities induced by a Western diet

Affiliations

Mice deficient in group VIB phospholipase A2 (iPLA2gamma) exhibit relative resistance to obesity and metabolic abnormalities induced by a Western diet

Haowei Song et al. Am J Physiol Endocrinol Metab. 2010 Jun.

Abstract

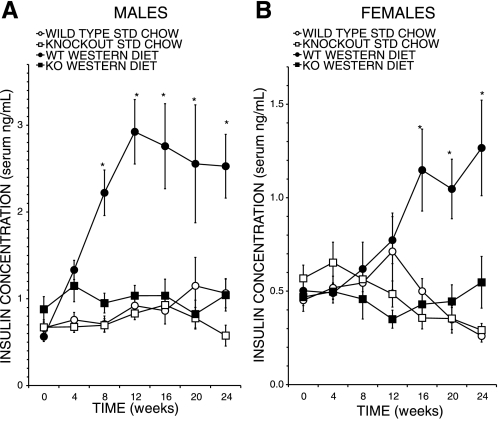
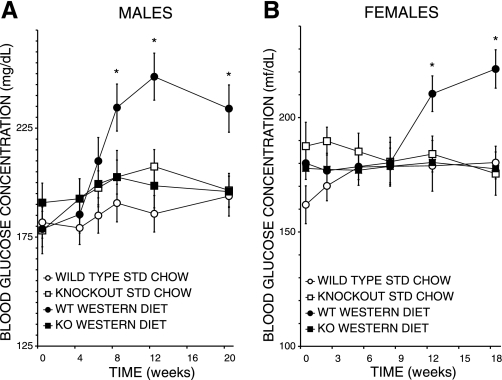
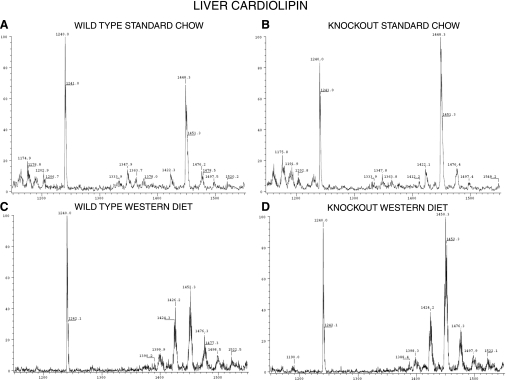
Phospholipases A(2) (PLA(2)) play important roles in metabolic processes, and the Group VI PLA(2) family is comprised of intracellular enzymes that do not require Ca(2+) for catalysis. Mice deficient in Group VIA PLA(2) (iPLA(2)beta) develop more severe glucose intolerance than wild-type (WT) mice in response to dietary stress. Group VIB PLA(2) (iPLA(2)gamma) is a related enzyme distributed in membranous organelles, including mitochondria, and iPLA(2)gamma knockout (KO) mice exhibit altered mitochondrial morphology and function. We have compared metabolic responses of iPLA(2)gamma-KO and WT mice fed a Western diet (WD) with a high fat content. We find that KO mice are resistant to WD-induced increases in body weight and adiposity and in blood levels of cholesterol, glucose, and insulin, even though WT and KO mice exhibit similar food consumption and dietary fat digestion and absorption. KO mice are also relatively resistant to WD-induced insulin resistance, glucose intolerance, and altered patterns of fat vs. carbohydrate fuel utilization. KO skeletal muscle exhibits impaired mitochondrial beta-oxidation of fatty acids, as reflected by accumulation of larger amounts of long-chain acylcarnitine (LCAC) species in KO muscle and liver compared with WT in response to WD feeding. This is associated with increased urinary excretion of LCAC and much reduced deposition of triacylglycerols in liver by WD-fed KO compared with WT mice. The iPLA(2)gamma-deficient genotype thus results in a phenotype characterized by impaired mitochondrial oxidation of fatty acids and relative resistance to the metabolic abnormalities induced by WD.


Figures

Fig. 1.
Fig. 1.
Body weights of Group VIB phospholipase A2 (iPLA2γ) knockout (KO) and wild-type (WT) mice fed Standard Chow (SC) or a Western diet with a high fat content (WD). Male (A) or female (B) iPLA2γ-KO (squares) and WT (circles) mice were fed SC from the time of weaning until 8 wk of age and thereafter were fed either SC (open symbols) or a WD (closed symbols), as described in experimental procedures and elsewhere (6, 21). Mice were weighed between 0900 and 1100 on a top-loading balance. Mean values ± SE are indicated (n = 72). *Significantly (P < 0.05) greater weight in genotype and diet comparisons; +significantly greater weight only in genotype comparisons.
Fig. 2.
Fig. 2.
Body fat percentage of iPLA2γ-KO and WT mice fed SC or a WD. Male (A) or female (B) iPLA2γ-KO and WT mice were fed SC (light bars) or WD (dark bars) as in Fig. 1 and were anesthetized with pentobarbital sodium at age 6 mo. Body composition was then determined by DEXA as described in experimental procedures and elsewhere (9). Mean values for %body fat ± SE are indicated (n = 18). *Significantly (P < 0.05) higher value in genotype and diet comparisons.
Fig. 3.
Fig. 3.
Triolein absorption by iPLA2γ-KO and WT mice. After an overnight fast, [3H]triolein (1 μCi) in olive oil was administered to WT (○) or iPLA2γ-KO (●) mice by gavage, and blood samples were taken at 1, 2, 4, and 6 h thereafter, as described in experimental proceduresand elsewhere (35). Plasma was prepared, and its 3H content was determined by liquid scintillation spectrometry and expressed as dpm/10 μl plasma. Mean values ± SE (n = 9) are displayed. There were no significant differences between genotypes.
Fig. 4.
Fig. 4.
Diet effects on blood cholesterol levels of iPLA2γ-KO and WT mice. Cholesterol concentration (mg/dl) of plasma from 4-h-fasted WT (circles) or iPLA2γ-KO (squares) male (A) and female (B) mice fed SC (open symbols) or WD (closed symbols) as in Fig. 1 was determined enzymatically as described in experimental procedures and elsewhere (9). Mean values ± SE (n = 23) are displayed. *Significantly (P < 0.05) greater cholesterol level in genotype and diet comparisons; +significantly greater value only in diet comparisons.
Fig. 5.
Fig. 5.
Diet effects on plasma insulin concentrations of iPLA2γ-KO and WT mice. Insulin concentration (ng/ml) of plasma from 4-h-fasted WT (circles) or iPLA2γ-KO (squares) male (A) and female (B) mice fed SC (open symbols) or WD (closed symbols) as in Fig. 1 was determined by ELISA as described in experimental proceduresand elsewhere (6, 9). Mean values ± SE (n = 21) are displayed. *Significantly (P < 0.05) greater insulin level in genotype and diet comparisons.
Fig. 6.
Fig. 6.
Diet effects on blood glucose concentrations of iPLA2γ-KO and WT mice. Glucose concentration (mg/dl) of blood from 4-h-fasted WT (circles) or iPLA2γ-KO (squares) male (A) and female (B) mice fed SC (open symbols) or WD (closed symbols) as in Fig. 1 was determined enzymatically as described in experimental proceduresand elsewhere (6, 9). Mean values ± SE (n = 33) are displayed. *Significantly (P < 0.05) greater glucose level in genotype and diet comparisons.
Fig. 7.
Fig. 7.
Glucose tolerance tests of iPLA2γ-KO and WT mice fed SC or a WD. Male WT (A) or iPLA2γ-KO (B) WT (circles) mice were fed SC (●) or WD (■), as in Fig. 1. At age 6 mo, a baseline (time 0) blood sample was obtained; a glucose (2 mg/kg ip) solution was administered, and blood samples were collected 30, 60, and 120 min thereafter, as described in experimental proceduresand elsewhere (6, 9). Glucose concentrations were determined as in Fig. 6. Mean values ± SE (n = 23) are displayed. *Significantly (P < 0.05) greater glucose level in diet and genotype comparisons.
Fig. 8.
Fig. 8.
Diet effects on glucose tolerance tests area under the curve (AUC) for iPLA2γ-KO and WT mice. Experiments were performed as in Fig. 7, and the area under the glucose concentration vs. time curve was calculated as described (8). Delta (gray bars) represents the difference between AUC values for mice of a given sex and genotype fed SC (light bars) or WD (dark bars) as in Fig. 1. Mean values ± SE are indicated (n = 23). *Significantly (P < 0.05) greater value in genotype and diet comparisons; x, significantly greater value only in genotype comparisons.
Fig. 9.
Fig. 9.
Insulin secretion in vivo and from pancreatic islets isolated from iPLA2γ-KO and WT mice fed SC or WD. A (in vivo secretion): experiments were performed as in Fig. 7, except that the glucose dose was 3 mg/kg ip, and blood samples for insulin determinations were collected at baseline (time 0) and 15 min after glucose administration as described in experimental procedures and elsewhere (8, 62). Mean values ± SE are indicated (n = 45). *Significantly (P < 0.05) greater value in genotype and diet comparisons; x, significantly greater value only in genotype comparisons. B: islets isolated from pancreata of WT (1st and 3rd bars in each set) or iPLA2γ-KO (2nd and 4th bars in each set) male mice were incubated (30 min, 37°C) in buffer containing 3, 8, or 20 mM d-glucose without or with 2.5 μM forskolin, and an aliquot of medium was then removed for measurement of insulin, as described in experimental procedures and elsewhere (6, 8, 62). Mean values ± SE are indicated (n = 39). *Significantly (P < 0.05) greater value in diet comparisons.
Fig. 10.
Fig. 10.
Insulin tolerance tests of iPLA2γ-KO and WTmice fed SC or WD. Human regular insulin (0.75 U/kg) was administered by ip injection to WT (■) or iPLA2γ-KO (●) male mice age 6 mo fed SC (A) or WD (B) as in Fig. 1, and blood was collected at baseline (time 0) and at 30, 60, and 120 min after injection to measure glucose concentration, as described in experimental procedures and elsewhere (6, 8, 62). Mean values ± SE are indicated (n = 39). *Significantly (P < 0.05) greater value in genotype and diet comparisons.
Fig. 11.
Fig. 11.
Diurnal variation of respiratory exchange ratio (RER) for iPLA2γ-KO and WT mice fed SC or WD. WT and iPLA2γ-KO mice were fed SC (STD CHOW) or WD (WEST DIET) as in Fig. 1, and at age 6 mo were studied in the fed state in a single-chamber indirect calorimetry system for 24 h with 12:12-h light-dark cycles, as described in experimental procedures and elsewhere (9). RER values were calculated hourly by instrumental software from V̇o2 and V̇co2 rates and are expressed as mean values for the entire 12-h light or dark cycle. SE are indicated (n = 80). *Significantly (P < 0.05) greater value in dark cycle vs. light cycle.
Fig. 12.
Fig. 12.
β-Oxidation of palmitic acid by gastrocnemius muscle of iPLA2γ-KO and WT mice fed SC or WD. WT (light bars) and iPLA2γ-KO (dark bars) mice were fed SC or WD as in Fig. 1, and at age 6 mo gastrocnemius muscle specimens were obtained and 14CO2 production from [14C]palmitate by muscle homogenates was determined as described in experimental procedures and elsewhere (16) and expressed as nmol CO2/mg muscle protein. Mean values ± SE are indicated (n = 12). *Significantly (P < 0.05) greater value in genotype comparisons; x, significantly greater weight in diet comparisons.
Fig. 13.
Fig. 13.
ESI-MS display of cardiolipin (CL) molecular species in gastrocnemius muscle from iPLA2γ-KO and WT mice fed SC or WD. Gastrocnemius muscle specimens were obtained as in Fig. 12 from WT (A and B) and iPLA2γ-KO (C and D) male mice age 6 mo fed Standard Chow (A and C) or a WD (B and D) as in Fig. 1, and mitochondrial lipid extracts were analyzed by negative ion ESI-MS to visualize [M − H] ions of native CL molecular species and of (14:0)4-CL internal standard (m/z 1240) as described in experimental procedures and elsewhere (30, 34).
Fig. 14.
Fig. 14.
ESI-MS display of CL molecular species in liver from iPLA2γ-KO and WT mice fed SC or WD. Liver specimens were obtained from WT (A and B) and iPLA2γ-KO (C and D) male mice age 6 mo fed SC (A and C) or WD (B and D) as in Fig. 1, and mitochondrial lipid extracts were analyzed by negative ion ESI-MS as in Fig. 13.
Fig. 15.
Fig. 15.
CL content of gastrocnemius muscle and liver of iPLA2γ-KO and WT mice fed SC or WD. Gastrocnemius muscle (A) or liver (B) specimens were obtained from WT and iPLA2γ-KO male mice age 6 mo fed SC (light bars) or WD (dark bars) as in Fig. 1, and mitochondrial lipid extracts were analyzed by negative ion ESI-MS as in Figs. 13 and 14. Native CL species were quantified relative to (14:0)4-CL internal standard as described in experimental procedures and elsewhere (30, 34). Mean values ± SE (n = 8) are indicated for the sum of endogenous CL molecular species expressed as nmol/mg tissue protein. *Significantly (P < 0.05) higher value in diet comparisons; x, significantly higher value in genotype comparisons.
Fig. 16.
Fig. 16.
ESI-MS display of acylcarnitine molecular species in gastrocnemius muscle from iPLA2γ-KO and WT mice fed SC or WD. Gastrocnemius muscle specimens were obtained as in Fig. 12 from WT (A and B) and iPLA2γ-KO (C and D) male mice age 6 mo fed SC (A and C) or WD (B and D) as in Fig. 1, and acylcarnitines in homogenates were analyzed as methyl esters relative to [2H3]acetylcarnitine internal standard by positive ion ESI-MS-MS scanning as described in experimental procedures and elsewhere (3, 22).
Fig. 17.
Fig. 17.
Acylcarnitine content and mean carbon chain length in gastrocnemius muscle and liver of iPLA2γ-KO and WT mice fed SC or WD. Gastrocnemius muscle (A and B) and liver (C and D) specimens were obtained as in Figs. 12 and 14, respectively, from WT (light bars) and iPLA2γ-KO (dark bars) male mice age 6 mo fed SC or WD as in Fig. 1, and acylcarnitine species in homogenates were quantitated by ESI-MS as in Fig. 16. A and C: values represent the sum of moles of acyl chain carbon for endogenous long-chain acylcarnitine (LCAC) species/mg tissue protein normalized to value for WTmice fed SC. B and D: values represent mean carbon chain length as computed from the ratio moles of acyl chain carbon relative to moles of acylcarnitine. Mean values ± SE (n = 10) are indicated. *Significantly (P < 0.05) higher value in genotype comparisons; x, significantly higher value in diet comparisons.
Fig. 18.
Fig. 18.
Acylcarnitine content of urine from iPLA2γ-KO and WT mice fed SC or WD. Urine was collected for 24 h on each of 4 consecutive days from male (A) or female (B) iPLA2γ-KO (dark bars) and WT (light bars) mice age 6 mo fed SC or WD as described in Fig. 1, and urine acylcarnitine content/g body wt was measured as in Fig. 17. Mean values ± SE are indicated (n = 25). *Significantly (P < 0.05) higher value in genotype comparisons; x, significantly higher value in diet comparisons.
Fig. 19.
Fig. 19.
Triacylglycerol (TAG) content of liver and gastrocnemius muscle of iPLA2γ-KO and WT mice fed SC or WD. Gastrocnemius muscle and liver specimens were obtained as in Figs. 12 and 14, respectively, from WT and iPLA2γ-KO male (A) and female (B) mice age 6 mo fed SC (light bars) or WD (dark bars) as in Fig. 1, and TAG content of lipid extracts was measured enzymatically as described in experimental procedures and elsewhere (25, 53, 55) and expressed as μg TAG/mg tissue protein. Mean values ± SE are indicated (n = 15). *Significantly (P < 0.05) higher value in genotype comparisons; x, significantly higher value in diet comparisons.
Fig. 20.
Fig. 20.
ESI-MS display of TAG molecular species in liver from iPLA2γ-KO and WT mice fed SC or WD. Liver specimens were obtained as in Figs. 14 from WT (A and B) and iPLA2γ-KO (C and D) male mice age 6 mo fed SC (A and C) or WD (B and D) as in Fig. 1, and lipid extracts were prepared as in Fig. 19 and analyzed by positive ion ESI-MS in infusion solution containing LiCl to visualize TAG [M+Li]+ ions as described in experimental procedures and elsewhere (33).

Similar articles

Cited by

References

    1. Ahmed K, Tunaru S, Langhans CD, Hanson J, Michalski CW, Kölker S, Jones PM, Okun JG, Offermanns S. Deorphanization of GPR109B as a receptor for the beta-oxidation intermediate 3-OH-octanoic acid and its role in the regulation of lipolysis. J Biol Chem 284: 21928– 21933, 2009 - PMC - PubMed
    1. Ahmed K, Tunaru S, Offermanns S. GPR109A, GPR109B and GPR81, a family of hydroxy-carboxylic acid receptors. Trends Pharmacol 30: 557– 62, 2009 - PubMed
    1. An J, Muoio DM, Shiota M, Fujimoto Y, Cline GW, Shulman GI, Koves TR, Stevens R, Millington D, Newgard CB. Hepatic expression of malonyl-CoA decarboxylase reverses muscle, liver and whole-animal insulin resistance. Nat Med 10: 268– 274, 2004 - PubMed
    1. Andreyev AY, Kushnareva YE, Starkov AA. Mitochondrial metabolism of reactive oxygen species. Biochemistry (Mosc) 70: 200– 214, 2005 - PubMed
    1. Bao S, Bohrer A, Ramanadham S, Jin W, Zhang S, Turk J. Effects of stable suppression of Group VIA Phospholipase A2 expression on phospholipid content and composition, insulin secretion, and proliferation of INS-1 insulinoma cells. J Biol Chem 281: 187– 198, 2006 - PMC - PubMed

Publication types

MeSH terms