Meal-induced hormone responses in a rat model of Roux-en-Y gastric bypass surgery
- PMID: 20179262
- PMCID: PMC2850245
- DOI: 10.1210/en.2009-1332
Meal-induced hormone responses in a rat model of Roux-en-Y gastric bypass surgery
Abstract
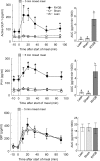
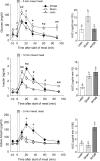
Roux-en-Y gastric bypass (RYGB) surgery is the most effective treatment for morbid obesity and remission of associated type 2 diabetes, but the mechanisms involved are poorly understood. The aim of the present study was to develop and validate a rat model for RYGB surgery that allows repeated measurement of meal-induced changes in gut and pancreatic hormones via chronic venous catheters. Male Sprague Dawley rats made obese on a palatable high-fat diet were subjected to RYGB or sham surgery and compared with chow-fed, lean controls. Hormonal responses to a mixed-liquid test meal were examined by frequent blood sampling through chronically implanted jugular catheters in freely behaving rats, 3-4 months after surgery, when RYGB rats had significantly reduced body weight and fat mass compared with sham-operated rats. Hyperleptinemia, basal hyperinsulinemia, and hyperglycemia as well as postprandial glucose intolerance seen in sham-operated, obese rats were completely reversed by RYGB and no longer different from lean controls. Postprandial increases in glucagon-like peptide-1, peptide YY, and amylin as well as suppression of ghrelin levels were all significantly augmented in RYGB rats compared with both sham-operated obese and lean control rats. Thus, our rat model replicates most of the salient hormonal and glycemic changes reported in obese patients after RYGB, with the addition of amylin to the list of potential candidate hormones involved in hypophagia, weight loss, and remission of diabetes. The model will be useful for elucidating the specific peripheral and central mechanisms involved in the suppression of appetite, loss of body weight, and remission of type 2 diabetes.
Figures


Similar articles
-
Changes in gastrointestinal hormone responses, insulin sensitivity, and beta-cell function within 2 weeks after gastric bypass in non-diabetic subjects.Obes Surg. 2012 Jul;22(7):1084-96. doi: 10.1007/s11695-012-0621-4. Obes Surg. 2012. PMID: 22359255
-
Postprandial Nutrient Handling and Gastrointestinal Hormone Secretion After Roux-en-Y Gastric Bypass vs Sleeve Gastrectomy.Gastroenterology. 2019 May;156(6):1627-1641.e1. doi: 10.1053/j.gastro.2019.01.262. Epub 2019 Feb 8. Gastroenterology. 2019. PMID: 30742833
-
Roux-en-Y gastric bypass and sleeve gastrectomy: mechanisms of diabetes remission and role of gut hormones.J Clin Endocrinol Metab. 2013 Nov;98(11):4391-9. doi: 10.1210/jc.2013-2538. Epub 2013 Sep 20. J Clin Endocrinol Metab. 2013. PMID: 24057293
-
Mechanisms of improved glycaemic control after Roux-en-Y gastric bypass.Dan Med J. 2015 Apr;62(4):B5057. Dan Med J. 2015. PMID: 25872541 Review.
-
Changes in gastrointestinal hormones and leptin after Roux-en-Y gastric bypass procedure: a review.J Am Diet Assoc. 2010 Apr;110(4):571-84. doi: 10.1016/j.jada.2009.12.023. J Am Diet Assoc. 2010. PMID: 20338283 Free PMC article. Review.
Cited by
-
Involvement of the vagus nerve in the anorectic effect of monoacylglycerol acyltransferase 2 inhibition in mice.Obes Sci Pract. 2023 Jul 6;9(6):601-608. doi: 10.1002/osp4.693. eCollection 2023 Dec. Obes Sci Pract. 2023. PMID: 38090688 Free PMC article.
-
Influence of Roux-en-Y gastric bypass on plasma bile acid profiles: a comparative study between rats, pigs and humans.Int J Obes (Lond). 2016 Aug;40(8):1260-7. doi: 10.1038/ijo.2016.46. Epub 2016 Mar 22. Int J Obes (Lond). 2016. PMID: 27089995
-
GLP-1R responsiveness predicts individual gastric bypass efficacy on glucose tolerance in rats.Diabetes. 2014 Feb;63(2):505-13. doi: 10.2337/db13-0511. Epub 2013 Nov 1. Diabetes. 2014. PMID: 24186863 Free PMC article.
-
Role of capsaicin-sensitive peripheral sensory neurons in anorexic responses to intravenous infusions of cholecystokinin, peptide YY-(3-36), and glucagon-like peptide-1 in rats.Am J Physiol Endocrinol Metab. 2014 Oct 15;307(8):E619-29. doi: 10.1152/ajpendo.00024.2014. Epub 2014 Aug 12. Am J Physiol Endocrinol Metab. 2014. PMID: 25117406 Free PMC article.
-
Weight-independent changes in blood glucose homeostasis after gastric bypass or vertical sleeve gastrectomy in rats.Gastroenterology. 2011 Sep;141(3):950-8. doi: 10.1053/j.gastro.2011.05.050. Epub 2011 Jul 12. Gastroenterology. 2011. PMID: 21699789 Free PMC article.
References
-
- Wickremesekera K, Miller G, Naotunne TD, Knowles G, Stubbs RS 2005 Loss of insulin resistance after Roux-en-Y gastric bypass surgery: a time course study. Obes Surg 15:474–481 - PubMed
-
- Ali MR, Fuller WD, Rasmussen J 2009 Detailed description of early response of metabolic syndrome after laparoscopic Roux-en-Y gastric bypass. Surg Obes Relat Dis 5:346–351 - PubMed
-
- Korner J, Bessler M, Cirilo LJ, Conwell IM, Daud A, Restuccia NL, Wardlaw SL 2005 Effects of Roux-en-Y gastric bypass surgery on fasting and postprandial concentrations of plasma ghrelin, peptide YY, and insulin. J Clin Endocrinol Metab 90:359–365 - PubMed
-
- Korner J, Inabnet W, Conwell IM, Taveras C, Daud A, Olivero-Rivera L, Restuccia NL, Bessler M 2006 Differential effects of gastric bypass and banding on circulating gut hormone and leptin levels. Obesity (Silver Spring) 14:1553–1561 - PubMed
Publication types
MeSH terms
Substances
Grants and funding
LinkOut - more resources
Full Text Sources
Medical
Research Materials

