. 2010 Feb 23;3(110):ra13.
doi: 10.1126/scisignal.2000634.

Apoptotic cells activate the "phoenix rising" pathway to promote wound healing and tissue regeneration

Affiliations

Apoptotic cells activate the "phoenix rising" pathway to promote wound healing and tissue regeneration

Fang Li et al. Sci Signal. .

Abstract

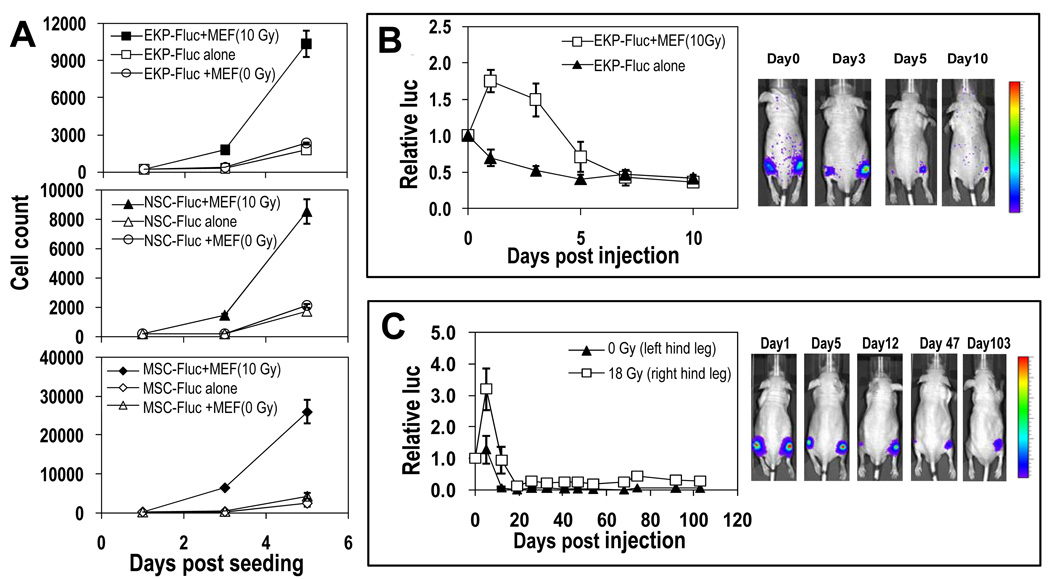
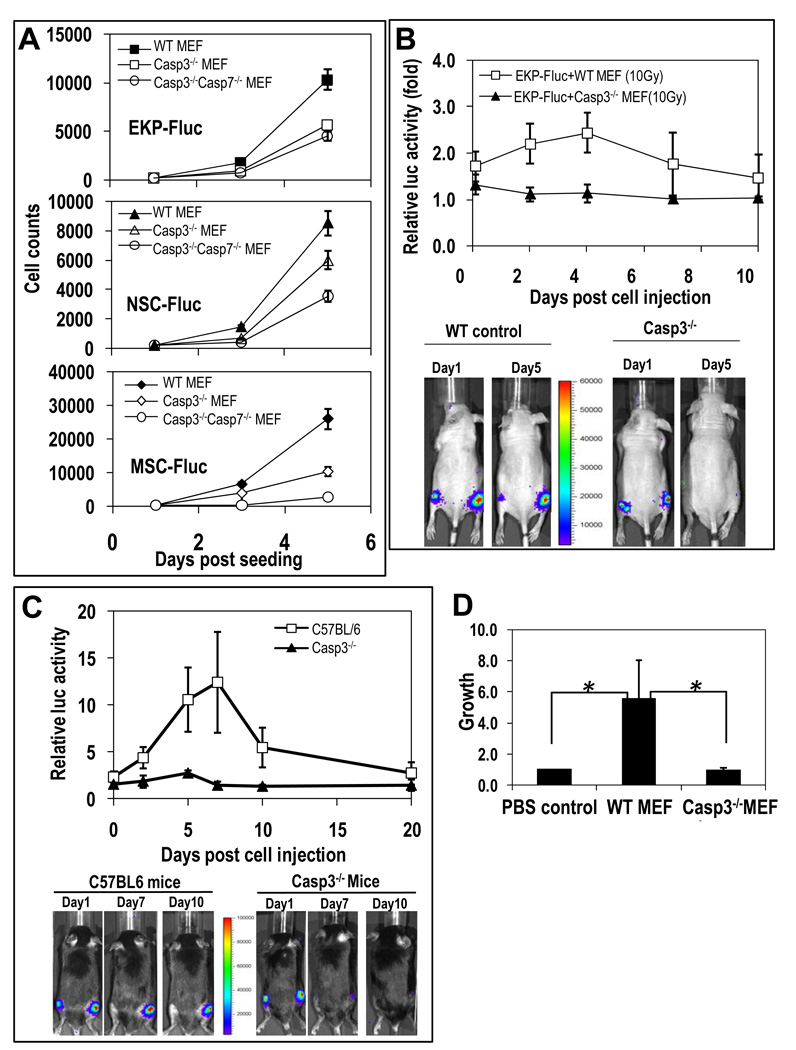
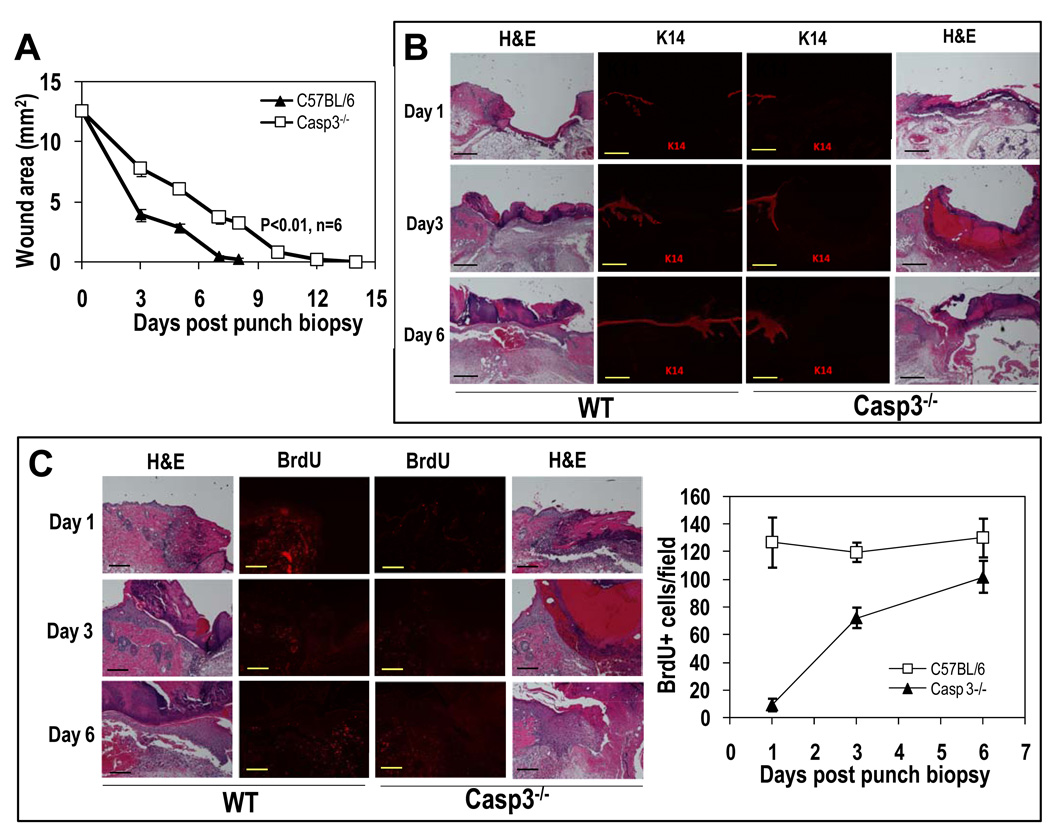
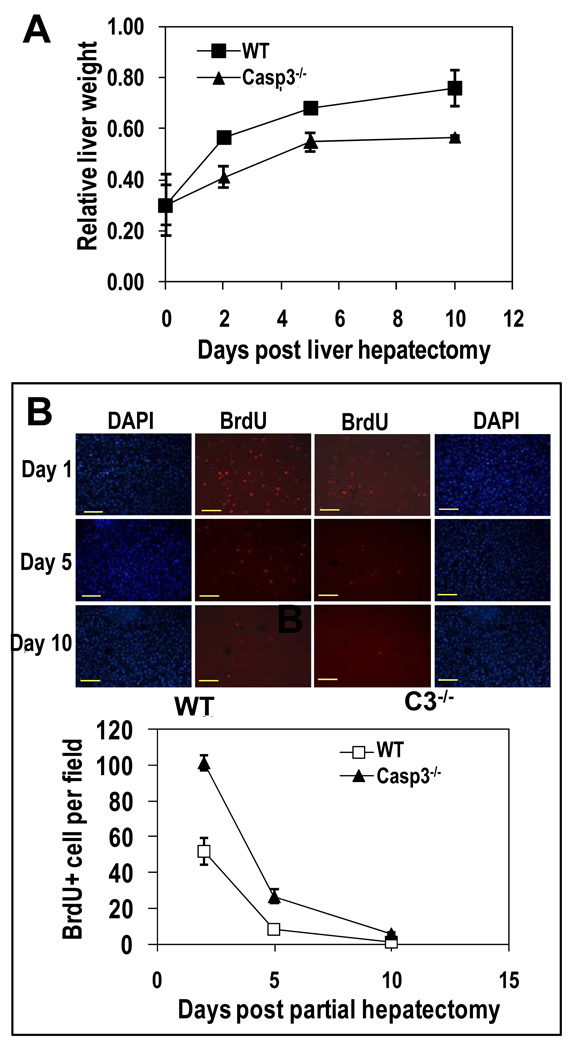
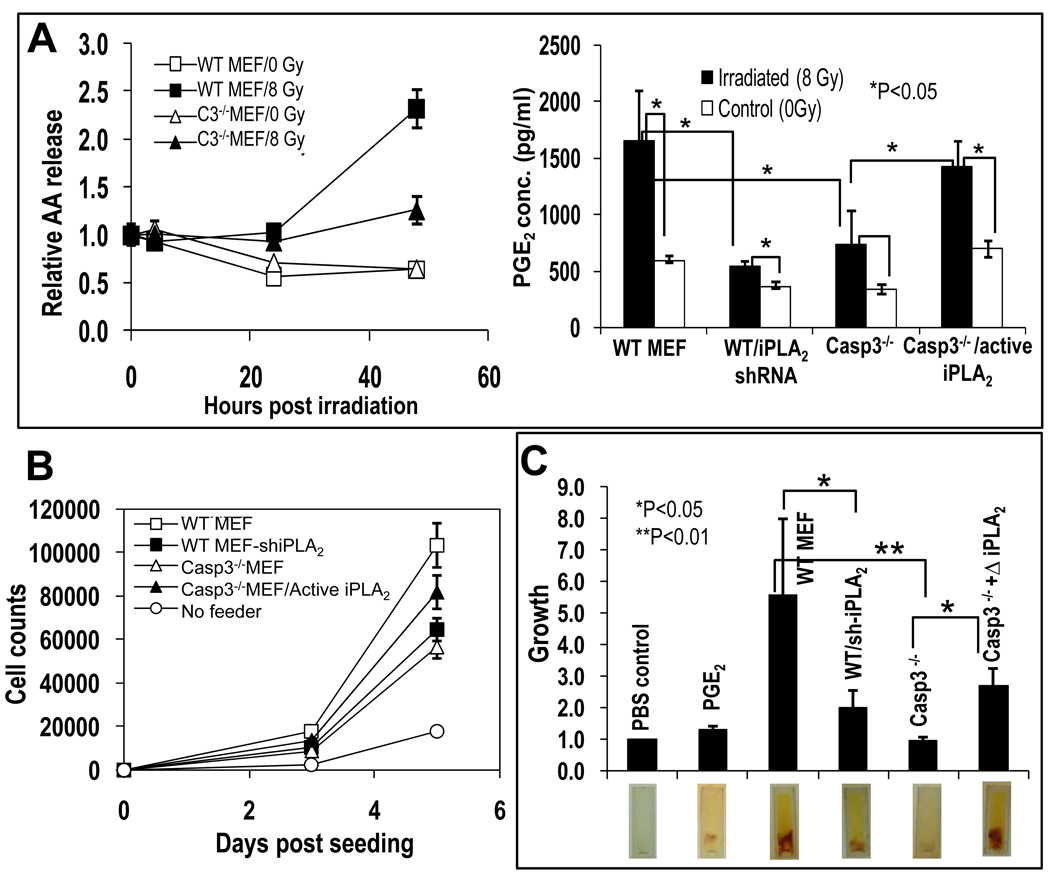
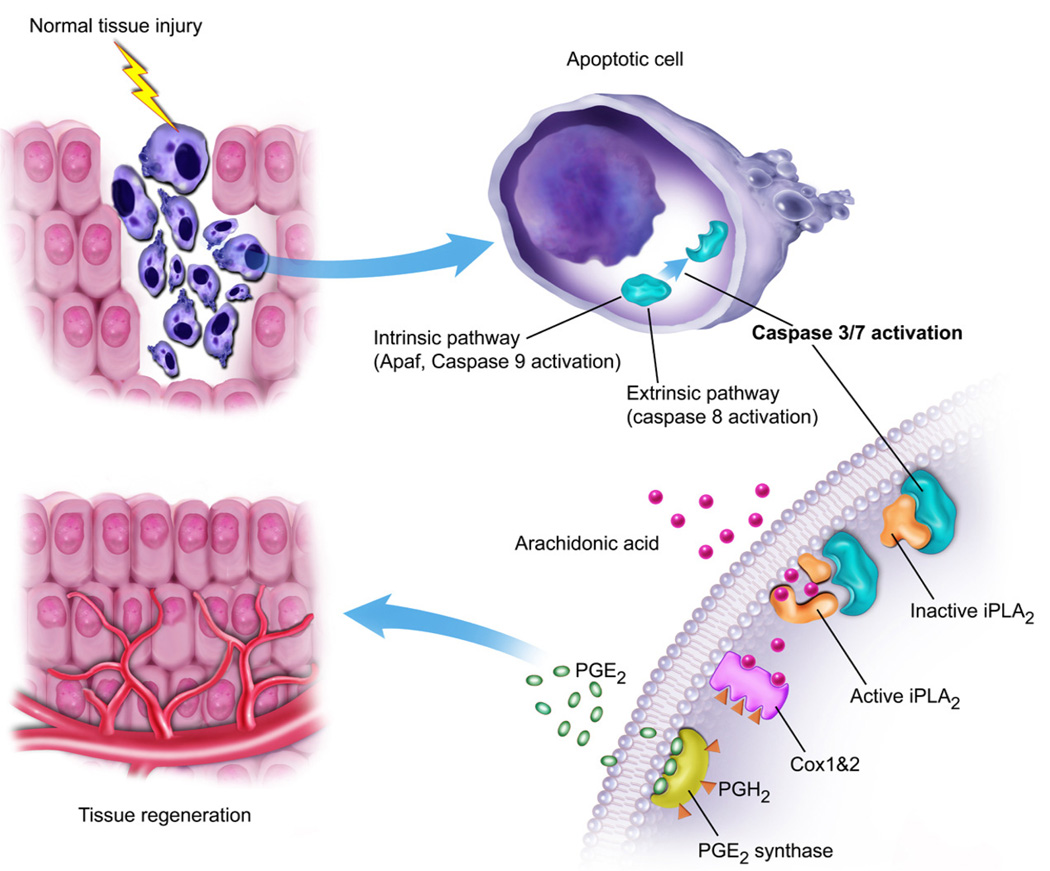
The ability to regenerate damaged tissues is a common characteristic of multicellular organisms. We report a role for apoptotic cell death in promoting wound healing and tissue regeneration in mice. Apoptotic cells released growth signals that stimulated the proliferation of progenitor or stem cells. Key players in this process were caspases 3 and 7, proteases activated during the execution phase of apoptosis that contribute to cell death. Mice lacking either of these caspases were deficient in skin wound healing and in liver regeneration. Prostaglandin E(2), a promoter of stem or progenitor cell proliferation and tissue regeneration, acted downstream of the caspases. We propose to call the pathway by which executioner caspases in apoptotic cells promote wound healing and tissue regeneration in multicellular organisms the "phoenix rising" pathway.


Figures

Fig. 1
Fig. 1. Stimulation of stem or progenitor cell proliferation by dying cells
(A) Lethally irradiated MEF cells were mixed with Fluc-labeled mouse EKP, NSC, or MSC cells and Fluc-labeled cell proliferation was quantified with bioluminescence imaging (see fig. S1). (B) EKP-Fluc cells were injected subcutaneously into the hind legs of nude mice either alone (left leg) or with lethally irradiated MEF cells (right leg). The EKP-Fluc cells were then imaged. The relative luciferase activity normalized against day 0, right after injection, is graphed (P<0.01, t test, n=5 total, days 1, 3, 5). (C) About 2 × 10⁵ EKP-Fluc cells were injected subcutaneously into left (unirradiated) or right (irradiated with 18 Gy) hind legs of nude mice and monitored for growth. Signals at later time points were normalized to the signals on day 0 (P<0.05 the entire course of experiment one-way ANOVA test, n=5 total,).
Fig. 2
Fig. 2. Critical role of caspase 3 in cell death stimulation of stem and progenitor cell proliferation
(A) Proliferation of 200 Fluc-labeled stem or progenitor cells mixed with lethally irradiated MEF cells were monitored in 24-well plates serially with bioluminescence imaging. The error bars represents SEM. In all three groups, the differences between the wild-type and Casp3−/− groups are statistically significant (P<0.05, t-test, n=4 independent samples). The differences between the Casp3−/− groups and the Casp3−/−Casp7−/− groups are also significant (P<0.05, t-test, n=4). (B) EKP-Fluc cells injected alone or with lethally irradiated MEFs were monitored with bioluminencence imaging. Relative luciferase activities from co-injected EKP-Fluc (in the right hind legs) normalized against those from cells injected alone (in the left hind legs) are graphed. The difference between the two groups are significant (P<0.01, one-way ANOVA test, n=5,). (C) Growth of EKP-Flu cells in wild-type and Casp3−/− mice. Relative luciferase activity in the irradiated legs normalized against those in the non-irradiated legs (P<0.05, n=5 each in wild type and knockout mice, one-way ANOVA test). (D) MEF cells induced tissue growth in a modified DIVAA assay. Host tissue growth into silicone cylinders was quantified by FITC-lectin staining of endothelial cells in the vasculature. Signals were normalized against phosphate buffered saline (PBS) control. Cylinders were prepared with PBS, wild-type MEFs, or Casp3−/− MEFs mixed with BME prior to implantation. The differences in tissue growth into the cylinders containing the wild-type MEFs versus the PBS control and versus the knockout MEFs were significant (*P<0.05,t test, n=6 cylinders in 6 different mice for each group).
Fig. 3
Fig. 3. Key roles for caspase 3 in skin wound healing
(A) Healing of 4-mm circular excision wounds in C57BL/6-derived wild-type and Casp3−/− mice. Wound healing was monitored through periodic measurement with a caliper. Data are plotted as the changes in the average areas +SEM) of wounds from the two groups of 8 mice with two wounds each. (P<0.01, one-way ANOVA test, n=16 wounds in each group). (B) Full-thickness skin samples containing entire wound sites were biopsied from wild-type and Casp3−/− mice at different time points after punch biopsy. Paraffin-embedded samples were sectioned and analyzed with antibodies against cytokeratin 14 (K14), a marker for skin epithelial cellsHematoxylin and eosin (H&E) staining shows basic tissue and cellular structures. The scale bars represent 500 µm. (C) BrdU staining in skin biopsies containing full-thickness wounds. The scale bars represent 200 µm. BrdU staining was quantified by counting and averaging 6 randomly chosen 100x fields on 6 mice. The error bars represent SEM. (P<0.01, t test, n=6).
Fig. 4
Fig. 4. Key roles of caspase 3 in liver regeneration after partial hepatectomy
(A) Assessment of liver regeneration after partial hepatectomy by measuring liver weight. The ratios of the average weight (+/− SEM) of regenerated livers (from mice that have undergone partial hepatectomy) against un-resected liver weight are graphed. (P<0.01 on and after day 2, t test, n=5). (B) Cell proliferation (BrdU-positive cells) at different time points after partial hepatectomy. Representative images are shown in the upper panels (scale bars, 100 µm). Nuclei were stained with DAPI. Lower panel shows quantitation of BrdU-positive cells by counting the average number of BrdU-positive cells in 4 randomly chosen 200x fields. Average and SEM are plotted. The difference between the two groups is statistically significant on days 2 and 5 (P<0.01, t test, n=4 mice in each group).
Fig. 5
Fig. 5. A role for caspase 3-mediated activation of iPLA2 in cell death stimulation of stem or progenitor cell proliferation
(A) Left panel: Arachidonic acid (AA) release from wild-type and Casp3−/− MEF cells with or without irradiation. The difference in AA release between irradiated wild-type and casp3−/− MEF cells are statistically significant at 48 hrs (t-test, n=3, P<0.01). The graph was plotted as relative levels of [3H]-archidonic acid in the supernatant, which were derived by normalizing [3H]-AA levels at different time points against those in the supernatant taken right before irradiation. Right panel: Prostaglandin E2 (PGE2) concentration in the supernatants of nontreated and irradiated wild-type and Casp3−/− MEF cultures. Data are plotted as the average and SEM and statistically significant differences are noted (t test, n=3). (B) Role of iPLA2 in cell death-mediated stimulation of EKP cell proliferation in vitro. Data are plotted as the average and SEM (n=5, t-test). (C)The importance of iPLA2 in tissue growth in a modified DIVAA assay. Top panel: Quantification of host tissue vasculature from cylinders containing various MEF cells. All the data were normalized against the PBS (phosphate-buffered saline) control group, which serves as the negative control. Statistically significant differences are noted (XXX test, n=X). Lower panel: Photographs of representative cylinders after removal from the mice. Tissue growth (yellowish color) into the cylinder is apparent. The red smears are red blood cells that are part of the host tissue that has grown into the cylinder.
Fig. 6
Fig. 6. A schematic representation of the “Phoenix Rising” pathway of cell death-induced tissue regeneration pathway
In damaged tissues, apoptotic cells activate caspase 3 and 7 through either the intrinsic pathways, involving APAF and caspase 9, or extrinsic pathways, involving caspase 8. Activated caspase 3 and 7 subsequently cleave and activate iPLA2, which generates arachidonic acid. Arachidonic acid is then converted into PGH2 by cyclooxygenases 1 and 2 (Cox1&2). PGE2 synthase converts PGH2 into PGE2, which stimulates stem cell proliferation and tissue regeneration.

References

    1. Gurtner GC, Werner S, Barrandon Y, Longaker MT. Wound repair and regeneration. Nature. 2008;453:314–321. - PubMed
    1. Birnbaum KD, Sanchez Alvarado A. Slicing across kingdoms: regeneration in plants and animals. Cell. 2008;132:697–710. - PMC - PubMed
    1. Slack JM, Savage S. Regeneration of mirror symmetrical limbs in the axolotl. Cell. 1978;14:1–8. - PubMed
    1. Brockes JP, Kumar A. Plasticity and reprogramming of differentiated cells in amphibian regeneration. Nat Rev Mol Cell Biol. 2002;3:566–574. - PubMed
    1. Sanchez Alvarado A. Planarian regeneration: its end is its beginning. Cell. 2006;124:241–245. - PubMed

Publication types