

Trends in the work hours of physicians in the United States
- PMID: 20179284
- PMCID: PMC2915438
- DOI: 10.1001/jama.2010.168
Trends in the work hours of physicians in the United States
Abstract
Context: Recent trends in hours worked by physicians may affect workforce needs but have not been thoroughly analyzed.
Objectives: To estimate trends in hours worked by US physicians and assess for association with physician fees.
Design, setting, and participants: A retrospective analysis of trends in hours worked among US physicians using nationally representative workforce information from the US Census Bureau Current Population Survey between 1976 and 2008 (N = 116,733). Trends were estimated among all US physicians and by residency status, sex, age, and work setting. Trends in hours were compared with national trends in physician fees, and estimated separately for physicians located in metropolitan areas with high and low fees in 2001.
Main outcome measure: Self-reported hours worked in the week before the survey.
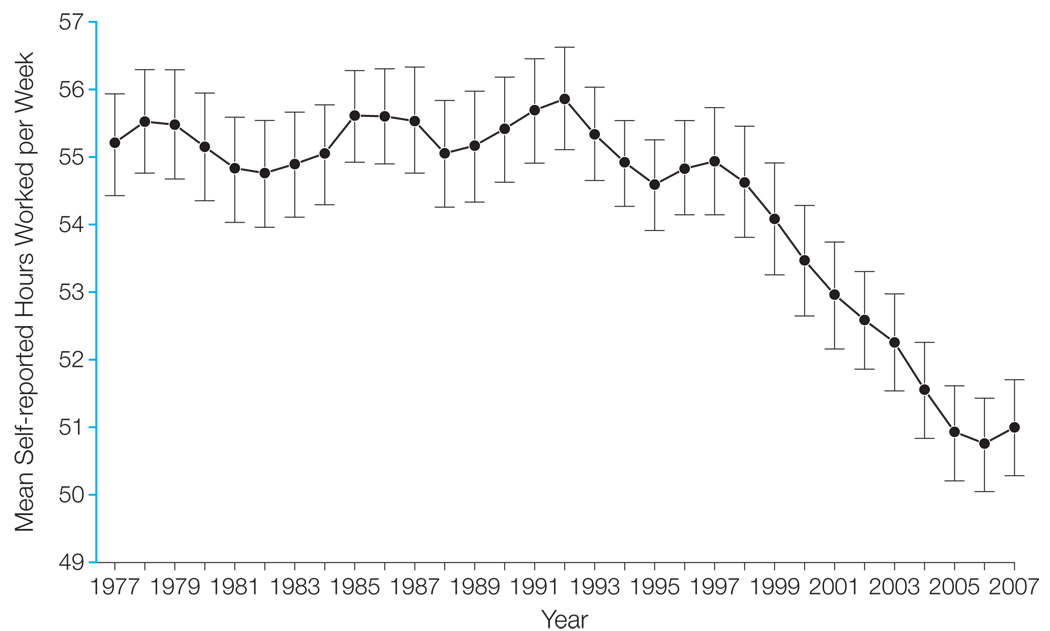
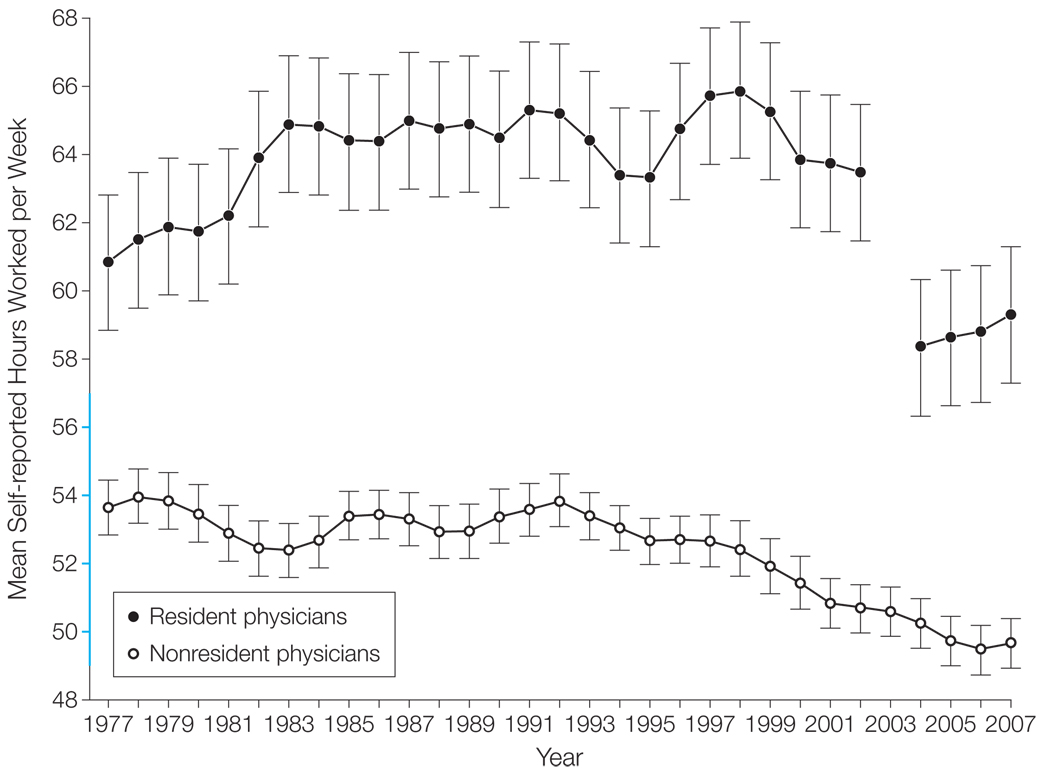
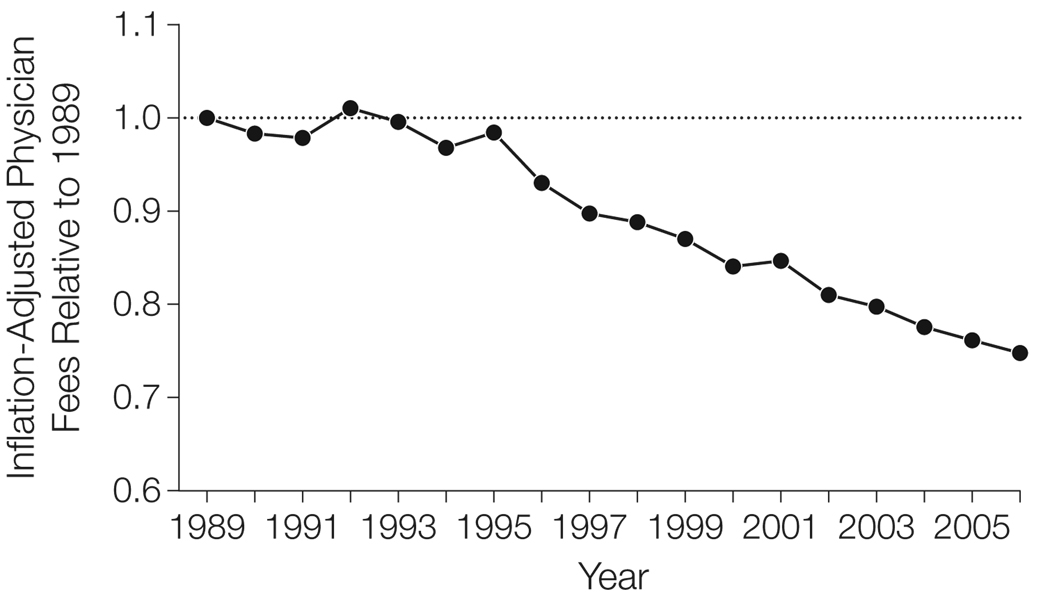
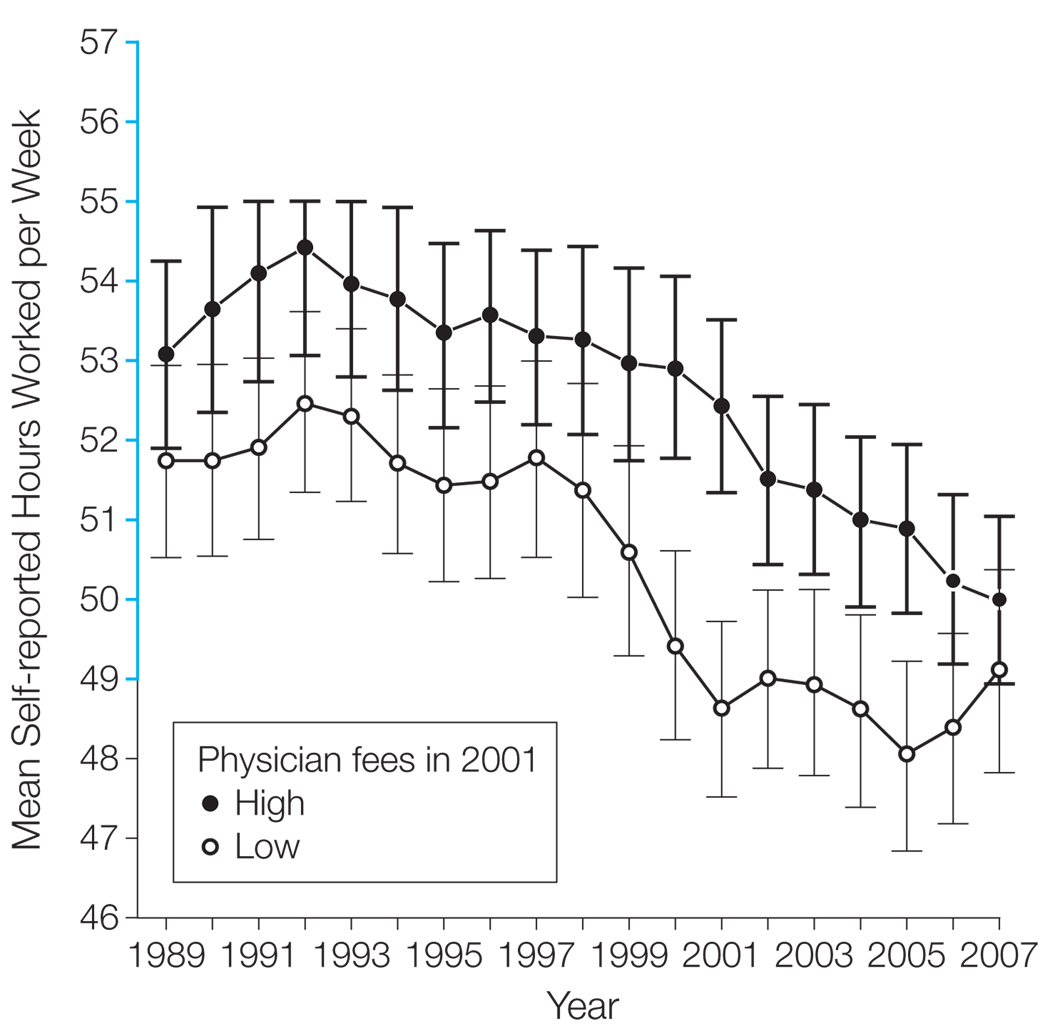
Results: After remaining stable through the early 1990s, mean hours worked per week decreased by 7.2% between 1996 and 2008 among all physicians (from 54.9 hours per week in 1996-1998 to 51.0 hours per week in 2006-2008; 95% confidence interval [CI], 5.3%-9.0%; P < .001). Excluding resident physicians, whose hours decreased by 9.8% (95% CI, 5.8%-13.7%; P < .001) in the last decade due to duty hour limits imposed in 2003, nonresident physician hours decreased by 5.7% (95% CI, 3.8%-7.7%; P < .001). The decrease in hours was largest for nonresident physicians younger than 45 years (7.4%; 95% CI, 4.7%-10.2%; P < .001) and working outside of the hospital (6.4%; 95% CI, 4.1%-8.7%; P < .001), and the decrease was smallest for those aged 45 years or older (3.7%; 95% CI, 1.0%-6.5%; P = .008) and working in the hospital (4.0%; 95% CI, 0.4%-7.6%; P = .03). After adjusting for inflation, mean physician fees decreased nationwide by 25% between 1995 and 2006, coincident with the decrease in physician hours. In 2001, mean physician hours were less than 49 hours per week in metropolitan areas with the lowest physician fees, whereas physician hours remained more than 52 hours per week elsewhere (P < .001 for difference).
Conclusion: A steady decrease in hours worked per week during the last decade was observed for all physicians, which was temporally and geographically associated with lower physician fees.
Figures
Comment in
-
Trends in US physician work hours.JAMA. 2010 Jun 9;303(22):2250; author reply 2250-1. doi: 10.1001/jama.2010.731. JAMA. 2010. PMID: 20530775 No abstract available.
References
-
- Medicare Payment Advisory Commission. Report to the Congress: improving incentives in the Medicare program. [Accessed January 21, 2010]. http://www.medpac.gov/documents/Jun09_EntireReport.pdf.
-
- US Congressional Budget Office. Key issues in analyzing major health insurance proposals. [Accessed January 21, 2010]. http://www.cbo.gov/ftpdocs/99xx/doc9924/12-18-KeyIssues.pdf.
-
- US Government Accountability Office. Testimony before the Committee on Health, Education, Labor, and Pensions, US Senate: primary care professionals: recent supply trends, projections, and valuation of services. [Accessed January 21, 2010]. http://www.gao.gov/new.items/d08472t.pdf.
-
- Senate Finance Committee. Call to action: health reform 2009. [Accessed January 21, 2010]. http://finance.senate.gov/healthreform2009/finalwhitepaper.pdf.
-
- US Department of Health and Human Services, Health Resources and Services Administration. Physician supply and demand: projections to 2020. [Accessed January 21, 2010]. ftp://ftp.hrsa.gov/bhpr/workforce/PhysicianForecasting-Paperfinal.pdf.
