. 2010 Mar;120(3):871-82.
doi: 10.1172/JCI41440. Epub 2010 Feb 22.

Elastase 2 is expressed in human and mouse epidermis and impairs skin barrier function in Netherton syndrome through filaggrin and lipid misprocessing

Affiliations

Elastase 2 is expressed in human and mouse epidermis and impairs skin barrier function in Netherton syndrome through filaggrin and lipid misprocessing

Chrystelle Bonnart et al. J Clin Invest. 2010 Mar.

Abstract

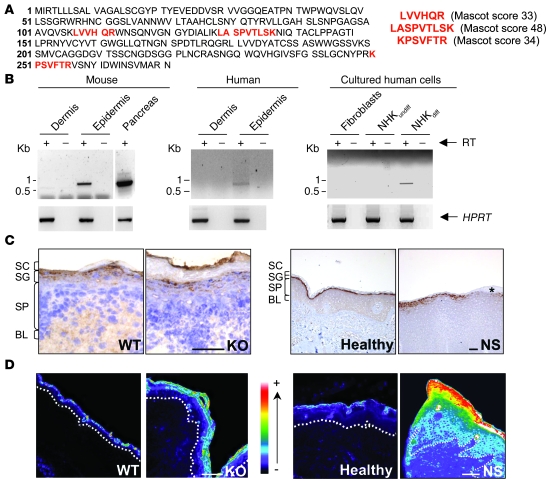
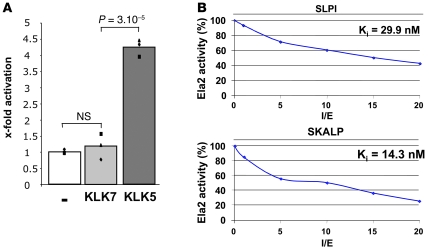
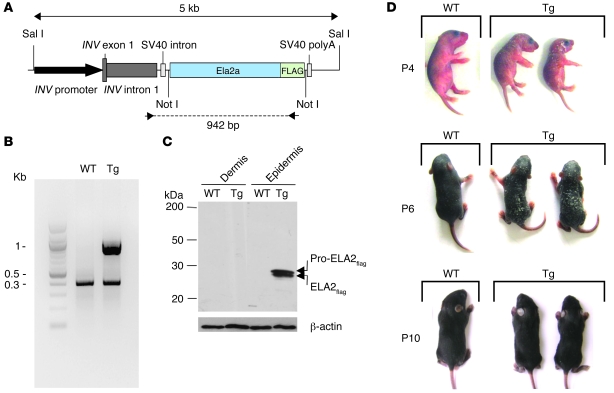
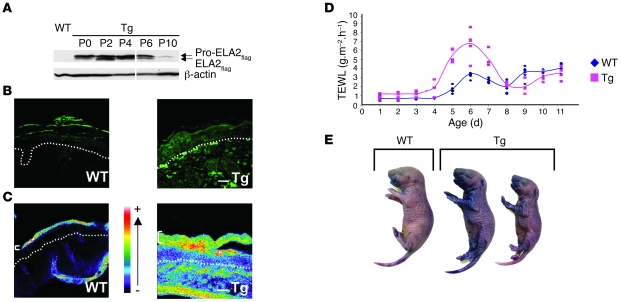
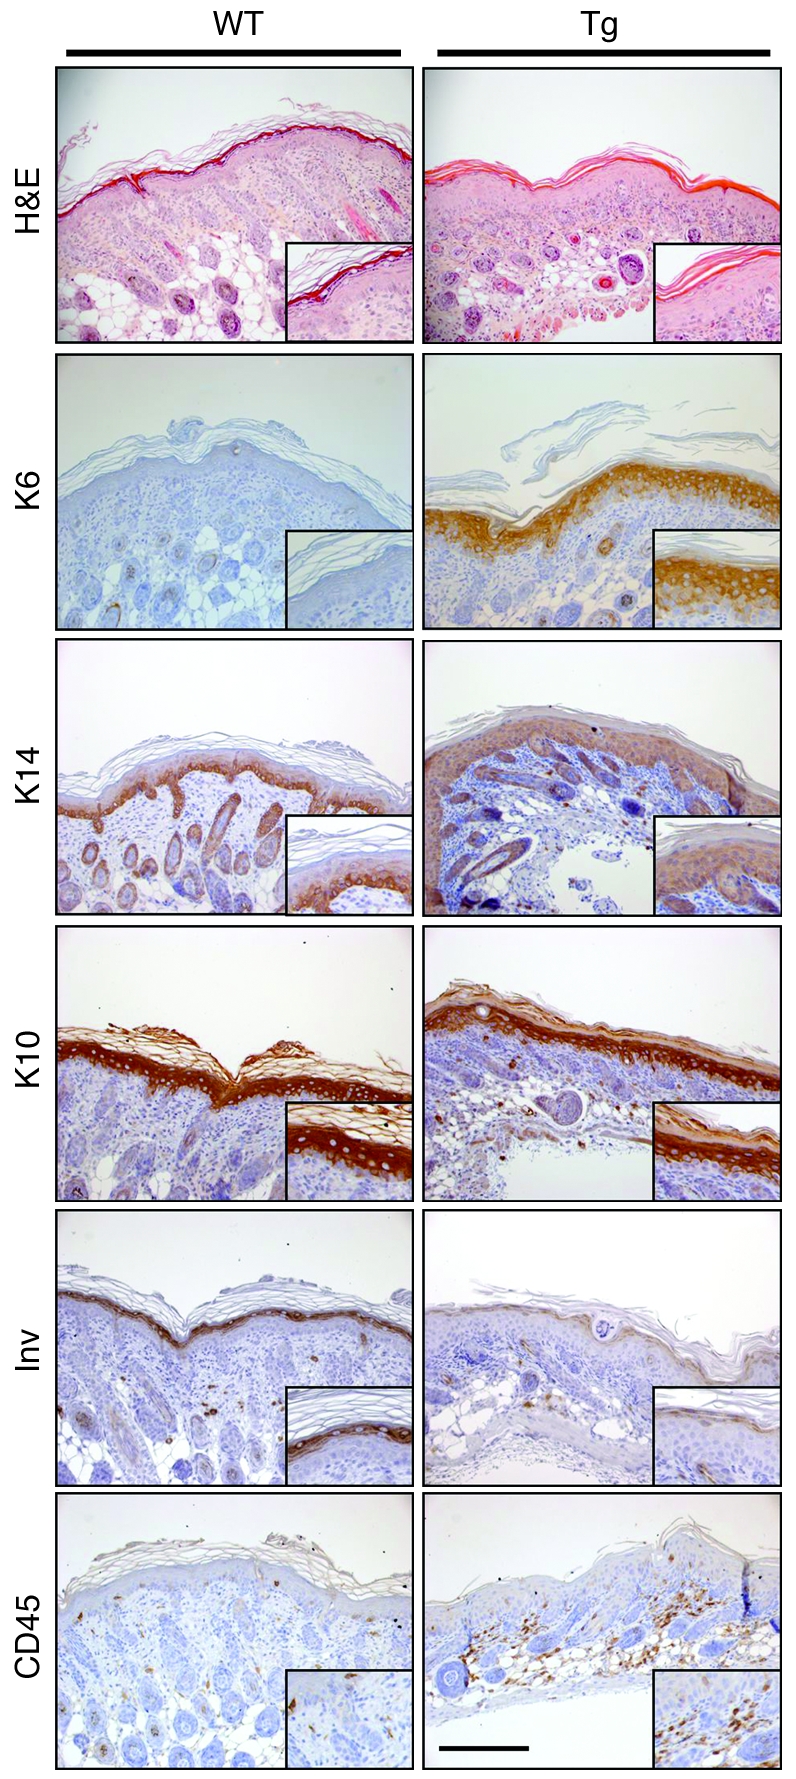
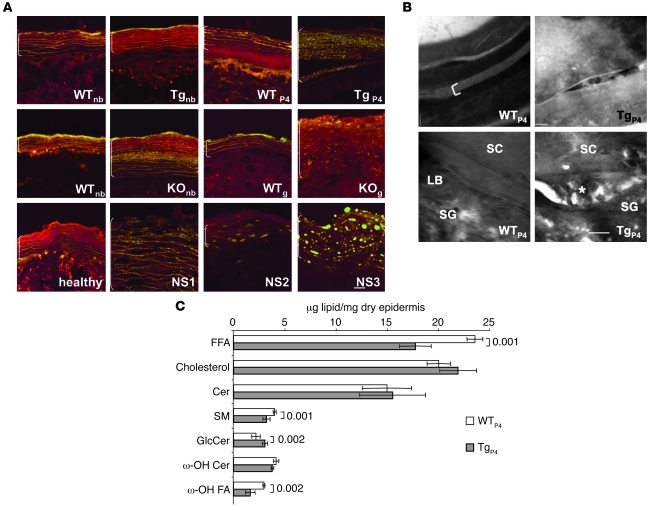
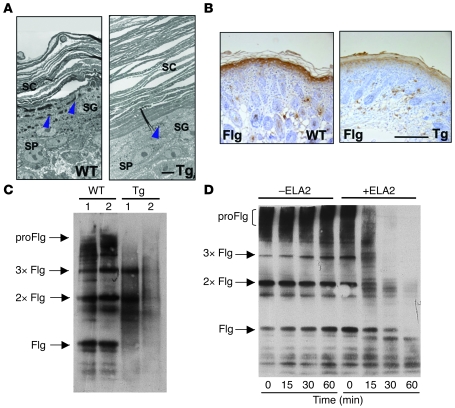
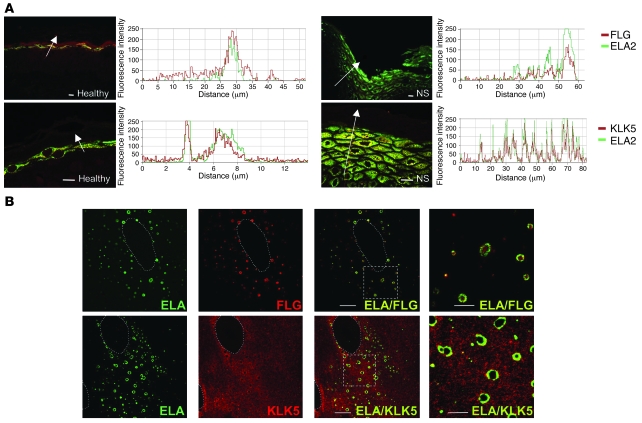
The human epidermis serves 2 crucial barrier functions: it protects against water loss and prevents penetration of infectious agents and allergens. The physiology of the epidermis is maintained by a balance of protease and antiprotease activities, as illustrated by the rare genetic skin disease Netherton syndrome (NS), in which impaired inhibition of serine proteases causes severe skin erythema and scaling. Here, utilizing mass spectrometry, we have identified elastase 2 (ELA2), which we believe to be a new epidermal protease that is specifically expressed in the most differentiated layer of living human and mouse epidermis. ELA2 localized to keratohyalin granules, where it was found to directly participate in (pro-)filaggrin processing. Consistent with the observation that ELA2 was hyperactive in skin from NS patients, transgenic mice overexpressing ELA2 in the granular layer of the epidermis displayed abnormal (pro-)filaggrin processing and impaired lipid lamellae structure, which are both observed in NS patients. These anomalies led to dehydration, implicating ELA2 in the skin barrier defect seen in NS patients. Thus, our work identifies ELA2 as a major new epidermal protease involved in essential pathways for skin barrier function. These results highlight the importance of the control of epidermal protease activity in skin homeostasis and designate ELA2 as a major protease driving the pathogenesis of NS.


Figures

Figure 1
Figure 1. Identification and characterization of ELA2, a new epidermal protease.
(A) Sequence of murine Ela2 precursor. The peptides identified by mass spectrometry are shown in bold red, corresponding to 8% sequence coverage. The score of each peptide is indicated. (B) RT-PCR analysis showing ELA2 mRNA expression in murine and human epidermis, but not in dermis. RT-PCR experiments performed from cultured cells with human ELA2 (UTR) primers, showing ELA2 mRNA expression in differentiated human keratinocytes, but not in undifferentiated keratinocytes nor fibroblasts. As a control, the hypoxanthine phosphoribosyl transferase (HPRT) gene was amplified in all samples. Lanes were run on the same gel but were noncontiguous (white lines). (C) Expression of ELA2 by immunohistochemistry on WT and Spink5–/– (KO) mouse skin as well as human healthy and NS skin sections. ELA2 is detected in the granular layer in each sample. The asterisk indicates the loss of ELA2 signal in an area where the granular layer is absent. BL, basal layer; SP, spinous layer. Scale bar: 75 μm. (D) In situ zymography analysis of normal and LEKTI-deficient mouse and human skins. Elastolytic activity is mainly found in the granular layer as well as in the SC of normal and LEKTI-deficient epidermis. The signal intensity is strongly increased and extended to the outermost layers of the spinous layer in LEKTI-deficient epidermis. Activity intensity is indicated in a pseudo-color gradient ranging from 0 (dark) to 255 (white). The dotted line represents the basal membrane of the epidermis. Scale bar: 50 μm.
Figure 2
Figure 2. KLK5, SLPI, and SKALP regulate ELA2 activity.
(A) Activation of pro-ELA2 by KLK5 and KLK7. The degradation velocity of BODIPY-FL-elastin by activated ELA2 was measured. In the proteolytic assay, KLK5 leads to an elastolytic activity increase of 4 times compared with the basal activity level of pro-ELA2 (–). No increase in elastolytic activity was observed with KLK7. Charts represent each individual value of 3 independent experiments (dots) and average (histograms). (B) Inhibition properties of SLPI and SKALP toward ELA2. ELA2 was incubated with increased concentrations of inhibitors. The curves represent the percentage of resulting elastolytic activity according to the ratio (inhibitor)/(enzyme) (I/E). Ki values are indicated. SKALP displays a better inhibitory capacity toward ELA2 compared with SLPI.
Figure 3
Figure 3. Tg-ELA2 mice display an ichthyotic phenotype.
(A) Representation of the transgenic cassette. The murine Ela2a cDNA fused with the FLAG tag was cloned downstream of the human involucrin (INV) promoter. (B) PCR analysis of genomic DNA with transgene-specific primers indicated by arrowheads in A showed the presence of a specific 1 kb-band in transgenic animals. As a control, exon 1 of the SPINK5 gene was amplified in both samples (0.4 kb-band). (C) Western blot analysis of WT and Tg-ELA2 (Tg) epidermal and dermal extracts, using an anti-FLAG antibody, reveals exogenous ELA2flag as pro-forms and active forms in the epidermis of transgenic animals. (D) Tg-ELA2 animals (Tg), compared with WT littermates, developed generalized scaling a few days after birth, accompanied by growth retardation. This phenotype was maximal between P4 and P6, then spontaneously regressed concomitantly with the beginning of hair growth.
Figure 4
Figure 4. Skin barrier defect is linked to ELA2flag expression and activity.
(A) Immunodetection of ELA2flag (pro-form and active forms) in Tg-ELA2 epidermal extracts. At birth (P0), only the pro-ELA2flag was detected. Active ELA2flag is detected from P2 to P6. Lanes were run on the same gel but were noncontiguous (white lines). (B) Immunofluorescence analysis showing expression of ELA2flag in the granular layer of the epidermis of Tg-ELA2 at P4. The dotted line represents the basal membrane of the epidermis. Scale bar: 125 μm. (C) In situ zymography analysis showing a strong elastolytic activity in suprabasal layers of the epidermis (brackets) and in the dermis of Tg-ELA2 mice. Activity intensity is indicated in a pseudocolor gradient ranging from 0 (dark) to 255 (white). The dotted line represents the basal membrane of the epidermis. Scale bar: 200 μm. (D) TEWL measurements. Between day 4 and day 8, the TEWL values were higher in Tg-ELA2 animals compared with the WT (up to 3.2 times on day 5). After day 8, TEWL values of WT and transgenic mice were similar. Charts represent each individual value (dot) and average (line). (E) Whole-mount dye penetration assay performed at day 4. Transgenic animals displayed skin areas with blue staining revealing an outside-in skin barrier defect compared with uncolored WT mice.
Figure 5
Figure 5. Alteration of the epidermal differentiation program in Tg-ELA2 animals.
Histological and immunohistochemical analysis of 4-day-old Tg-ELA2 epidermis. H&E staining of 4-day-old WT and Tg-ELA2 (Tg) epidermis shows thickening of the epidermis (acanthosis) with hypogranulosis and a compact SC in Tg-ELA2 mice. The hyperproliferation marker keratin 6 (K6) is not detectable in the WT epidermis, whereas it is strongly expressed in the suprabasal layers of Tg-ELA2 epidermis. The basal marker keratin 14 (K14) is extended to the suprabasal compartment in the transgenic epidermis. Keratin 10 (K10) is detected in all suprabasal layers of WT epidermis but is slightly reduced in intensity in the granular layer of transgenic animal. Involucrin (Inv) staining is reduced in intensity in Tg-ELA2 epidermis. The number of CD45-positive cells is significantly increased in the dermis of Tg-ELA2 mice. Scale bar: 250 μm. Higher magnifications of each panel are shown as insets.
Figure 6
Figure 6. Abnormal epidermal lipid organization and quantification.
(A) Nile red staining of mouse and human skin cryosections. In normal mouse (WT) and human (healthy) skin, extracellular lipid lamellae appear as yellow parallel lines. In the epidermis of newborn Tg-ELA2 mice (Tgnb), no abnormality is detectable, but numerous yellow lipid droplets are observed at P4 (TgP4). In KOnb mice, lipid droplets are visible in the central layers of the SC. In KOg, the staining reveals numerous lipid droplets and no extracellular lamellae. NS patient epidermis shows similar abnormal lipid droplets. Scale bar: 10 μm. (B) Structure of intercellular lipids revealed with RuO4 postfixation in 4-day-old WT and Tg-ELA2 epidermis. Note broad and compact lipid bilayers in WT SC (bracket). In contrast, unprocessed lipids are seen in the SC intercellular space in Tg-ELA2. At the SG-SC interface of WT epidermis, LB are observed. In Tg-ELA2, lipid material remains globular and disorganized (asterisk) and dilates the extracellular space. Scale bar: 10 nm. (C) Epidermal lipid content in 4-day-old Tg-ELA2 compared with WT animals. ω-hydroxy Cers, ω-OH Cer in CLE; ω-hydroxy fatty acids, ω-OH FA in CLE. Quantification shows a significant decrease in FFA, SM, and ω-OH FA amount in Tg-ELA2 epidermis, while GlcCer amount is significantly increased. Results represent the mean ± SD of 4 WT and 4 transgenic epidermis. Significant P values are indicated.
Figure 7
Figure 7. (Pro-)filaggrin is a target of ELA2.
(A) Ultrastructural analysis of 4-day-old Tg-ELA2 (Tg) shows hyperkeratosis and a reduction in size and number of keratohyalin granules (blue arrowheads). SP, spinous layer. Scale bar: 5 μm. Each panel is a composite of 2 images. (B) Filaggrin immunostaining is markedly decreased in 4-day-old Tg-ELA2 epidermis compared with littermate WT animals. Scale bar: 250 μm. (C) Immunodetection of profilaggrin (proFlg), filaggrin (Flg), and filaggrin-processing intermediate dimers (2xFlg) and trimers (3xFlg) in epidermal extract from a 4-day-old litter composed of 2 WT and 2 Tg-ELA2 animals (Tg). In Tg-ELA2 epidermis, profilaggrin and filaggrin intermediates are decreased in intensity and filaggrin monomers are not detectable. (D) In vitro degradation of (pro-)filaggrin by purified ELA2. Epidermal extracts from WT animals were incubated with (+) or without (–) purified ELA2 for different time periods (0, 15, 30, and 60 minutes) before Western blotting analyses using an anti-filaggrin antibody. In the absence of ELA2, no degradation of either filaggrin form is observed. In the presence of ELA2, profilaggrin and filaggrin intermediates are digested progressively with incubation time.
Figure 8
Figure 8. ELA2 colocalizes with filaggrin and KLK5 in differentiated keratinocytes and in vivo.
(A) Colocalization between ELA2 and SG-specific proteins in normal and NS skin sections. ELA2 staining (green) and FLG or KLK5 staining (red) were analyzed in confocal laser scanning microscopy. Graphs, representing the signal intensity from each protein along the arrow, show a perfect colocalization of both signals in normal as well as in NS epidermis in spite of the decreased filaggrin signal level. Scale bars: 25 μm. (B) Colocalization experiment of ELA2 with FLG or KLK5 in normal human keratinocytes differentiated in culture, analyzed by confocal laser scanning microscopy. ELA2 staining is quasi-exclusively localized around the (pro-)filaggrin–containing keratohyalin granules. KLK5 staining spreads in the entire cytoplasmic compartment, with concentrated areas at the periphery of the nucleus and around keratohyalin granules, where KLK5 and ELA2 colocalized. Note the presence of some intense yellow dots at a distance from the keratohyalin granules. Dotted outlines define the nucleus of the cells. The 2 far-right panels (ELA/FLG and ELA/KLK5) represent higher magnifications of the regions delineated by the dotted squares. Scale bar: 10 μm.

Similar articles

Cited by

References

    1. Fuchs E. Scratching the surface of skin development. Nature. 2007;445(7130):834–842. doi: 10.1038/nature05659. - DOI - PMC - PubMed
    1. Sandilands A, Sutherland C, Irvine AD, Irwin McLean WH. Filaggrin in the fronline: role in skin barrier function and disease. J Cell Sci. 2009;122(Pt 9):1285–1294. doi: 10.1242/jcs.033969. - DOI - PMC - PubMed
    1. Swartzendruber DC, Wertz PW, Kitko DJ, Madison KC, Downing DT. Molecular models of the intercellular lipid lamellae in mammalian stratum corneum. J Invest Dermatol. 1989;92(2):251–257. doi: 10.1111/1523-1747.ep12276794. - DOI - PubMed
    1. Uchida Y, et al. Epidermal sphingomyelins are precursors for selected stratum corneum ceramides. J Lipid Res. 2000;41(12):2071–2082. - PubMed
    1. Hart TC, et al. Mutations of the cathepsin C gene are responsible for Papillon-Lefevre syndrome. J Med Genet. 1999;36(12):881–887. - PMC - PubMed

Publication types

MeSH terms